
The Intelligence Bridge: Franchise & Enterprise Edition Issue #5
Issue #5: KPI Dictionary + Modality Analysis

Leaders Note
Most boutique fitness brands believe they understand their performance because they can see their own numbers.
What they couldn’t see, historically, is whether those numbers showed strength, weakness, or a quiet decline compared to the market around them.
Now they can.
We have pulled and standardized data across booking platforms, regions, and modalities - something that hasn’t been done before. What it reveals is that when problems do appear, the root cause isn’t failure or incompetence, but invisibility.
Many of the industry’s most sophisticated operators are looking closely at their numbers - but still can’t see emerging weaknesses in their modalities, simply because the data required to see it hasn’t existed until now.
And in this period of intense competition that blindspot has become dangerous.
Three questions now matter to leaders more than any others:
Are we underperforming or is our entire modality under pressure?
When clients try us versus our competitors, are they choosing us - and staying long enough to matter?
Is our revenue stable or growing because we’re executing well - or because loyalists are propping up the business while new members are quietly fading away to our peers?.
Leaders know their businesses cold. But until now they’ve had no real-time visibility into how the broader market they compete with is actually performing relative to them.
That gap has never mattered more than it does right now.
And the tools that have existed to date (booking platform dashboards, FDDs, consultant and industry reports) are structurally incapable of giving the real-time, cross-booking platform insight that operators need to win.
The consequences are immediate and sector-wide.
Franchisors and operators spend enormous time trying to fix performance problems without knowing if the problems are theirs - or the market’s.
Private equity firms invest in franchise systems without knowing whether the brands they back outperform or underperform the category - or even which levers to invest in to fix the problems they inherit
Analysts celebrate AUV growth without knowing whether the broader category is growing faster - meaning a brand could be quietly losing share despite positive headlines.
That’s why “where do we stand right now” becomes an urgent, non-deferrable question for leadership teams.
The positive is that true comparative analysis also reveals what’s achievable - for everyone. We see:
A small top decile of studios - regardless of brand - is thriving, while much of the industry is steering with incomplete and distorted metrics that make it impossible to close the gap
Operational excellence and local awareness are the true drivers of success - not brand; not modality
To be clear, that top-decile is running fundamentally different businesses - with different economics, priorities, and operating patterns.
But their playbook isn’t mysterious. We may not see every tactic, but we can see the levers - and those levers form a repeatable pattern that others can learn.
So the takeaway is clear - the competitive reality of the market means:
The most dangerous position is believing you’re performing well without knowing how you really compare
The upside of being forced to understand your competitive position is that you also understand how to become as good as the best
We also see that those who think they are the top, often are not
As these insights have started circulating, what’s striking is the competitive advantage this visibility creates.
Because in a competitive market, the danger isn’t being wrong - it’s being the last to see what your competitors already do.
Welcome to the age of clarity.
Welcome to the era of intelligence.
Nt Etuk
Founder & CEO, FitGrid
Co-Founder & Chairman, BFS Network

Next Section: Executive Summary

Executive Summary
Intelligence Bridge Issue #5: Modalities
This issue presents one of the clearest and most comprehensive views of boutique fitness to date, at a moment when measuring relative performance is critical for success.
Regardless of your organizational role, there is value in this document - and it will likely influence how you approach 2026. Those who absorb it will enter the year with clearer insight and a measurable advantage.
Still, this is a dense issue, and you do not need to read it linearly.
How to approach this issue
Start with the industry’s first standardized KPI dictionary
Skim this section (dive deep later). This shared language is the foundation for everything that follows
Choose a modality and review the data
See critical, structural problems in that modality
See the future potential of that modality
See what top decile operators are doing to win
Review the stakeholder implications
Understand what this means for your role
Review the charts showing why booking platform-provided “industry-wide insights” are misleading
They show how platform data reflects only part of the market
Each section includes a concise summary so readers can jump to what matters most.
In This Issue
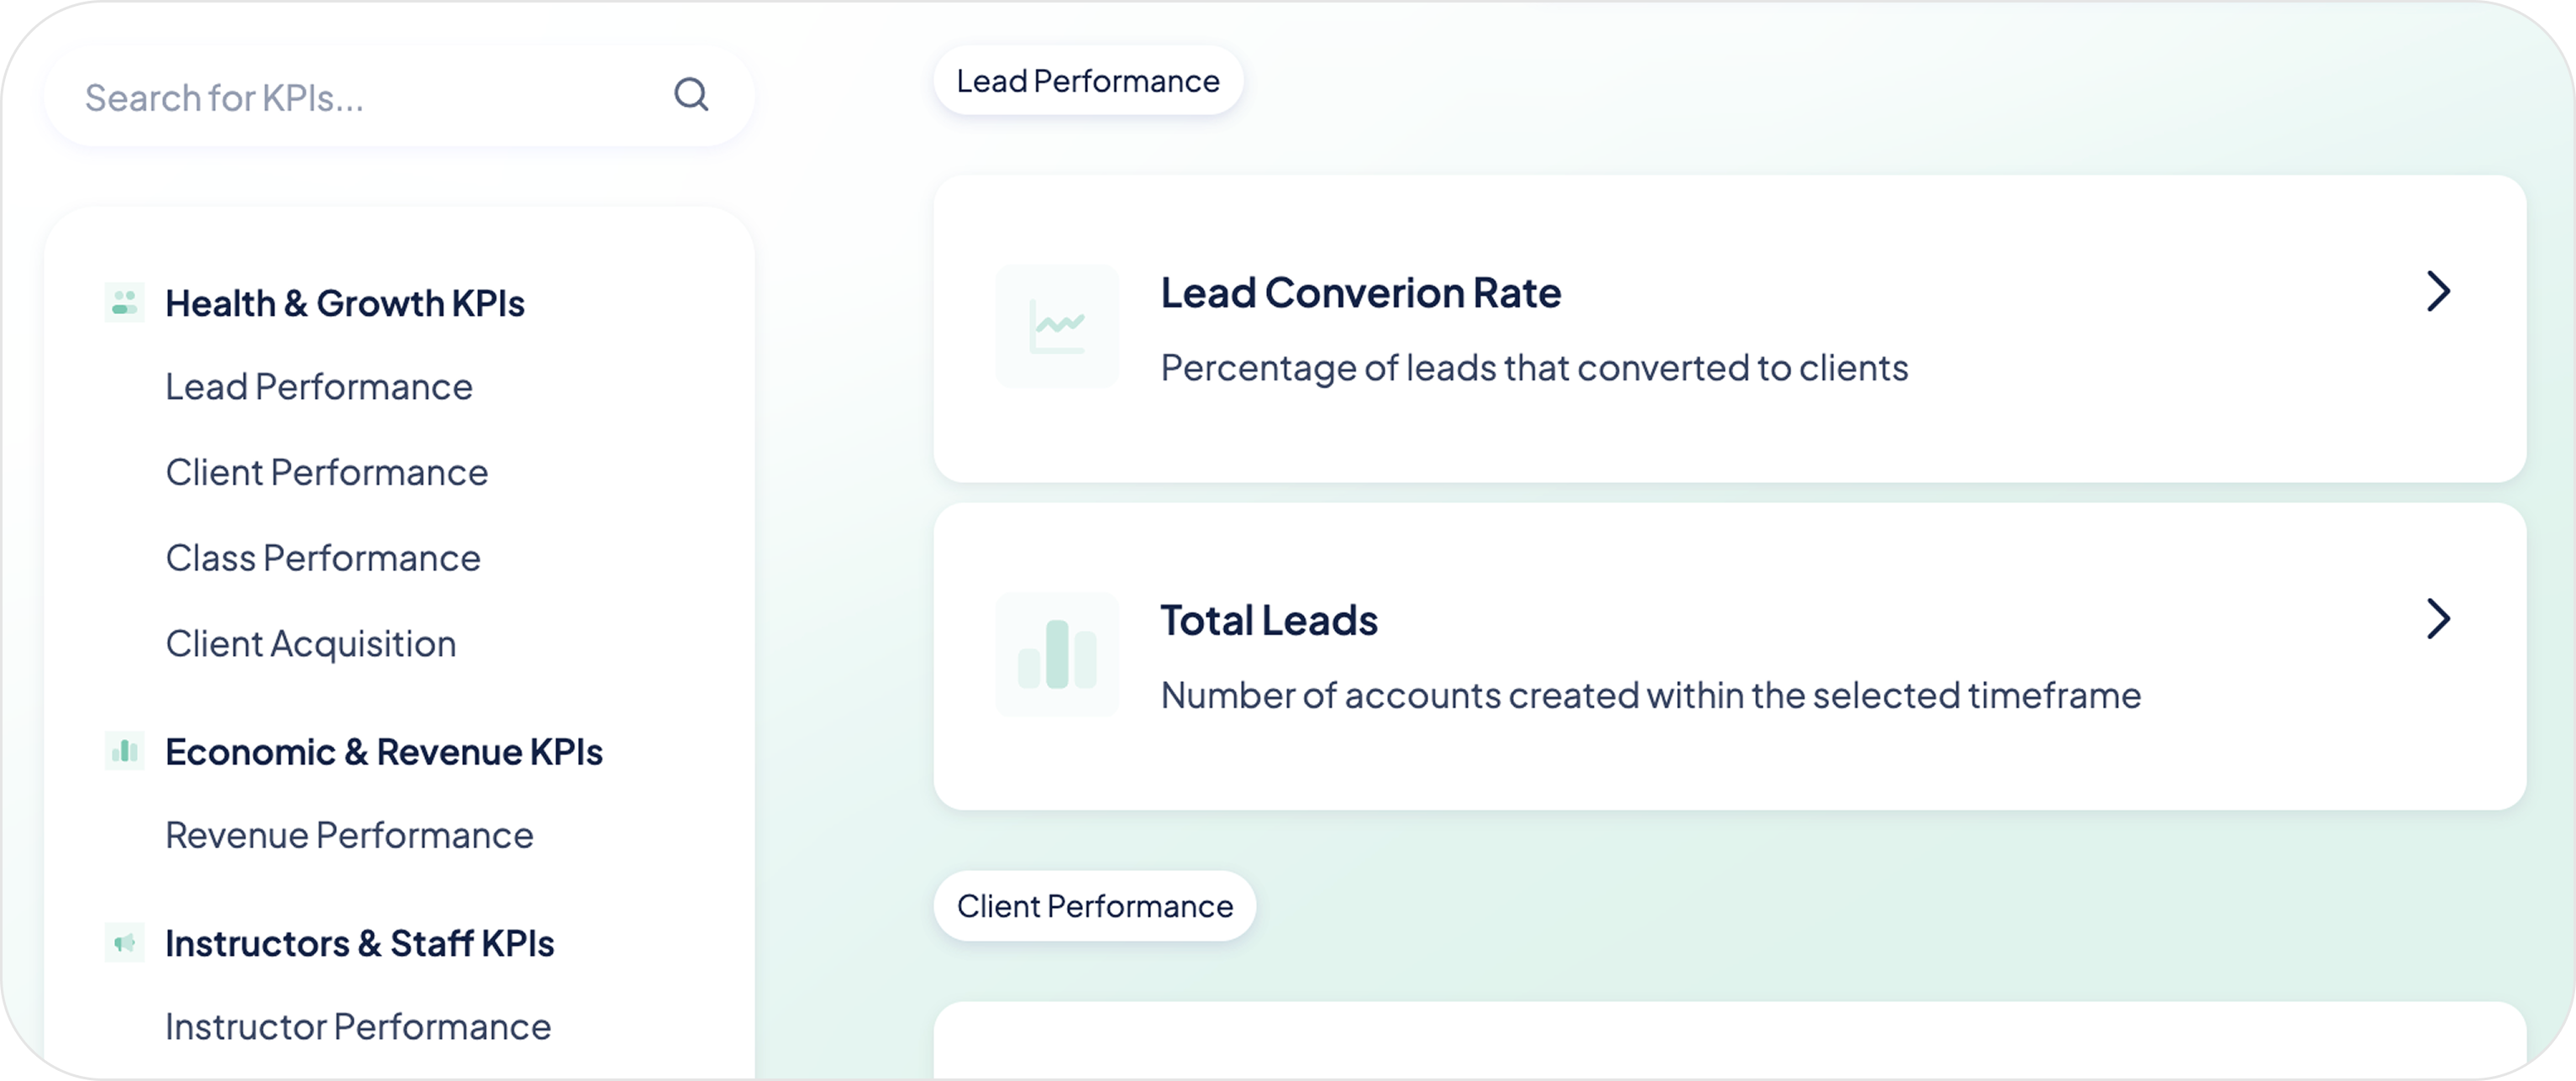
Universal Fitness KPI Dictionary
Booking platforms can define the same metric differently. It’s like two schools grading the same exam on different scales - one uses letter grades, the other pass/fail. The student marked “Pass” may have actually outperformed the student marked “A.” In boutique fitness, that’s how a studio showing 40% lead conversion on one platform can lose customers to a competitor showing 20% on another - without realizing it. In a competitive market, performance can only be understood through a shared language. This dictionary introduces that shared language for the industry.
Jump to Section ➜
Shocking Modality Truths
Critical insights on Pilates, Yoga, Barre, HIIT, and Cycling; what’s happening in the market, what top-decile operators do differently, and the questions each modality must now answer.
Jump to Section ➜
Future Modality Potential
Strong demand and enduring curiosity make boutique fitness a compelling long-term sector. Here is a modality-by-modality assessment of future potential, based on the data.
Jump to Section ➜
Debate-Ending Charts
These insights cannot be understood from booking platform-provided data. Since different platforms produce materially different studio behaviors and metrics, what they show as industry-wide data is actually only what’s happening inside their ecosystem. See the charts showing how the same metrics diverge materially across platforms.
Jump to Charts ➜
Questions That Will Be Asked
The Questions Analysts, Investors, Boards, and CEOs Will Now Ask
As benchmarks sharpen, so will scrutiny. Understand the new questions that analysts, boards, investors, dealmakers, franchisees, and even employees will expect leaders to answer.
Jump to Section ➜
Stakeholder Relevance
Why These Results Matter to Each Stakeholder
From operators to franchisors to investors and analysts, the implications of these findings are different - and material. See why this matters for you.
Jump to Section ➜
Download Report as PDF
Click to download this report as a PDF
Next Section: Standardized KPI Dictionary

Standardized KPI Dictionary
The Industry’s New Common Language
The Universal Fitness KPI Dictionary, produced by FitGrid, is the Rosetta Stone (the key that makes everything decipherable) for our space. Without standardized KPIs and metrics, nothing in boutique fitness can be compared. With them everything becomes clearer.
To be sure, comparisons matter primarily when competition is intense. In a non-competitive world a studio’s retention rate, by itself, can be sufficient information. In a competitive world, you need to be able to compare your retention rate. If one studio has low retention and a competing studio has high retention, the high studio is keeping clients the low studio will never see again.
But there’s a problem. Different booking systems define the same-named metrics differently. And different studios do as well.
Take “Lead Conversion”. Some booking systems have the tech to classify a social media “like” as a “lead”. Other systems can only see a “lead” when a new account is created. Same name. Wildly different calculation. Conversion is measured by one studio as a “1st visit to the studio” and by another as “purchase of a membership”. Not the same thing.
This means common terms mean completely different things.
FitGrid’s KPI Dictionary V1 standardizes the metrics that govern:
acquisition quality
early retention
mid-journey risk
monetization
lifetime value, and
instructor impact
This is a line in the sand for the industry.
Before now, performance in boutique fitness could only be understood inside individual platforms or brands. From this point forward, performance can be understood across the market, using a shared language. That shift changes how studios are evaluated, how franchisors are managed, how investors underwrite risk, and how the industry measures progress.
A standardized, cross-booking platform measurement system has never existed in boutique fitness before this.
The true impact of that is in the insights it allows.
This edition uses these standardized definitions to offer never-before understood insights about what is actually happening in different modalities.
The full 14 metric V1 version of the dictionary is now available. We will update it continuously as an opportunity for the industry to finally be able to see itself clearly.
These definitions represent the measurement standard FitGrid will maintain for the industry.
We anticipate franchisors, analysts, operators, booking platforms, consultants, and PE groups to adopt these definitions beginning in 2026. In prior issues of this newsletter we have highlighted those that already are, including the thousands of studios already using FitGrid - where it has been activated.
KPI Dictionary Example: At-Risk Percentage
To illustrate the power of standardization, here is one example metric: At-Risk %. This is a commonly used term across many booking platforms that means completely different things in different places.
We have defined it so it can be consistently calculated across all platforms. By our definition, it is one of the earliest and most reliable indicators of client drift and revenue decline.
On its own, it tells you how many clients are pulling back from your studio before they churn. When combined with other metrics - especially First-Time Client Return Rate - it becomes a leading predictor of Early LTV (lifetime value), which is how much money a client gives you over time. Early LTV is the fastest and biggest predictor of full LTV.
Screenshot: KPI Dictionary record for “At-Risk Client Rate”
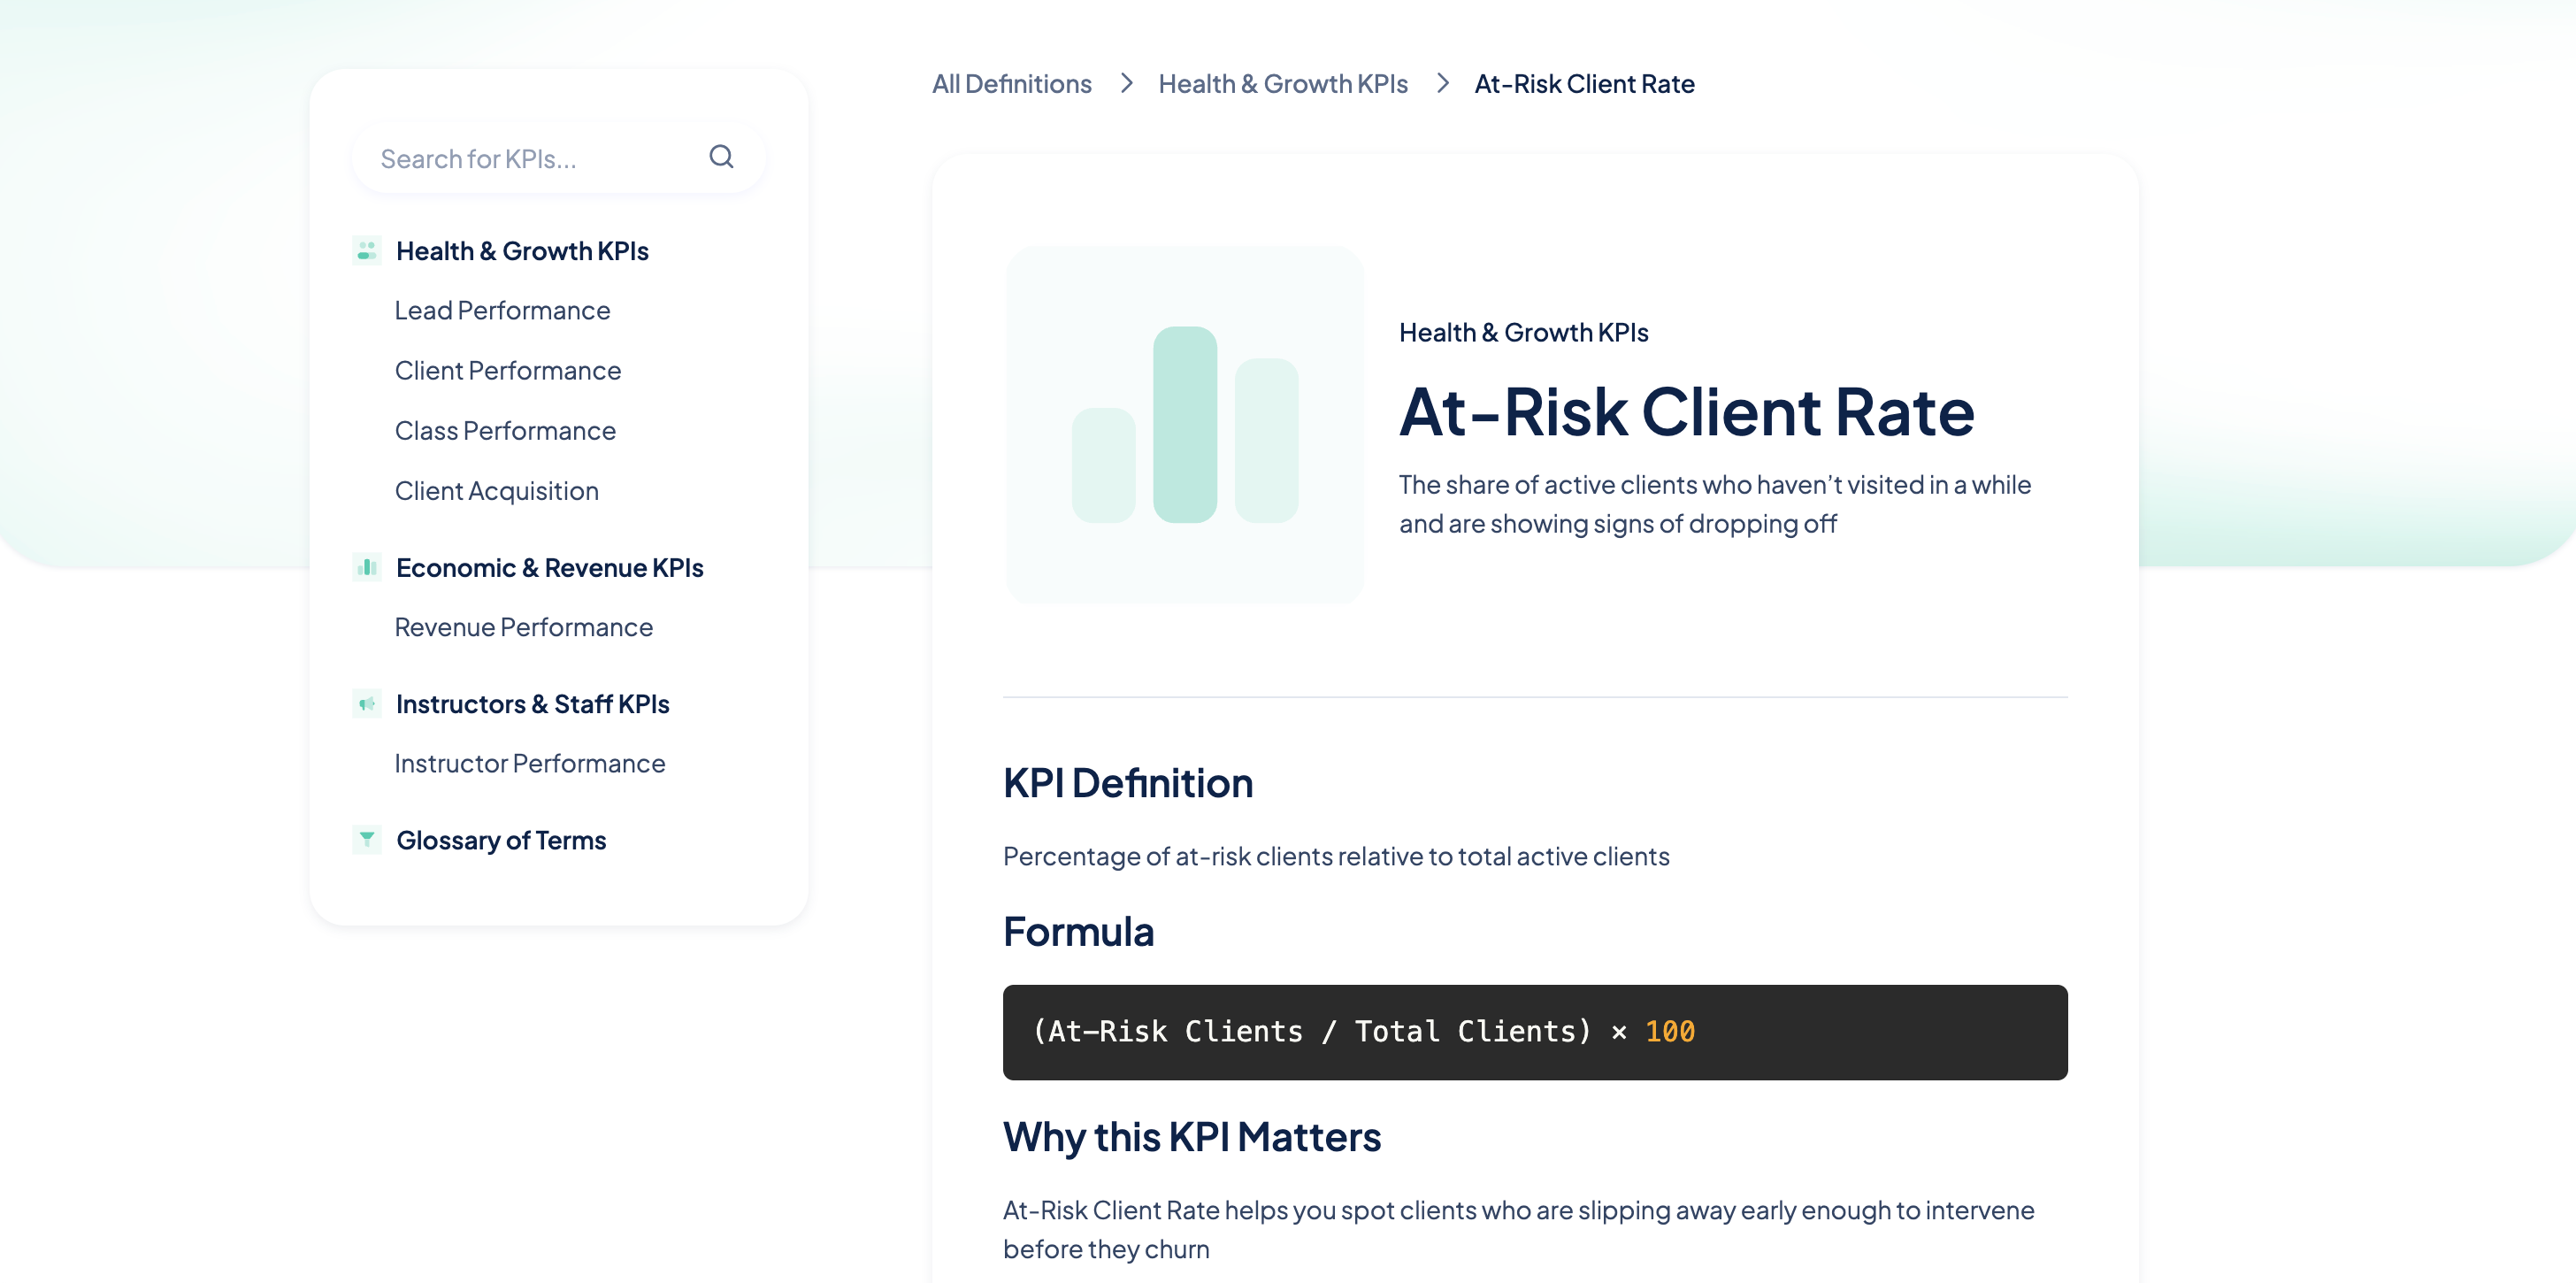
In other words, At-Risk % doesn’t just show visit trends; it reveals whether your studio is quietly losing revenue from clients who were previously active, and how quickly your client base is moving toward or away from long-term value.
At-Risk Percentage Definition
The percentage of active clients whose attendance has dropped by more than 50 percent in the last 30 days compared with the prior 30 days.
At-Risk Percentage Formula
(At-Risk Clients / Total Clients) × 100Why this KPI Matters
At-Risk % reveals client drift long before it shows up in churn, declining lifetime value, or empty classes. It is one of the earliest and most dependable indicators of future revenue decline.
Why it Must Be Standardized
Without a single definition, operators and franchisors cannot tell whether a rise in drift of clients away, is normal, execution-related, brand-related, competitive, or modality-wide. Standardization makes the metric comparable and actionable.
Next Section: Shocking Modality Truths

Shocking Modality Truths
Modality-by-Modality Analysis
Across all modalities, the industry is losing economic value in ways that were previously invisible:
New clients are 20 to 35 percent less valuable than a year ago
Rooms are 20 to 25 percent emptier
Clients complete 15 to 20 percent fewer sessions
Mid client-journey drift away from studios is rising across the board
Revenue per location is slipping even when lifetime value rises
Across every major modality, the industry is not declining - it is leaking. And leaks compound faster than growth.
These are not isolated problems. They are system-wide patterns.
But the top decile of operators has figured out how to thrive in this environment.
They understand that operational excellence - not brand, modality, or booking platform - is the strongest predictor of success. A top-decile independent studio consistently outperforms the average franchised brand location.
Critical Insight A
We are not giving away the “secret sauce” of top decile brands. How they actually achieve their metrics is still their proprietary information. We reveal the key metrics they focus on; not how they do it. In addition, this illumination is GOOD for top decile brands.
Think of it as a top decile studio is like owning a $10 million house. That house in a neighborhood that no one wants to come into (e.g. that modality in boutique fitness) caps the value of that house. But if you improve the neighborhood, as a whole, then the value of that $10 million house / top brand skyrockets.
Critical Insight B
All revenue related metrics reflect core class revenue. We do not include the effects of 3rd party products like Classpass or Wellhub/Gympass. We also do not analyze personal training sessions. And we do not include merchandise sales. Greater detail about metrics can be found in the Universal Fitness KPI dictionary.
Across all modalities, the math below is not theoretical - it simply translates everyday studio behavior into plain-English business outcomes.
Jump to Section
Pilates | Yoga | Barre | HIIT/Bootcamp | Cycling

Pilates
Declining Early Client Value
If you don’t know whether each new Pilates client today is worth less than last year, and by how much - this section is about you.
Metrics Used in Analysis
First-Time Return Rate
Revenue per Client
Lifetime Value
Key Pilates Findings
Pilates studios are quietly losing future revenue at the front door.
The average new Pilates client is now worth 15–25% less than last year - not because prices fell, but because fewer first-timers are coming back.
That means most studios now need roughly one-quarter more new clients just to earn the same revenue they earned last year.
Think of it like a leaky bucket: the water level looks fine, but every new bucketful you pour in is smaller than it used to be.
If this feels familiar, it’s because this pattern already exists in your system.
A small group of top studios has avoided this entirely - proving this is an execution problem, not a market problem.
What Pilates Operators Can Do
Treat the first 2–3 visits as a designed conversion sequence, not random class placements.
Require instructor follow-up for every first-timer; top studios convert through human connection.
Questions for Pilates Operators
Onboarding performance
Average studios lose a significant share of first-timers immediately, while top performers retain nearly all of them. Do you know where your system stands?
Early retention risk
Studios with weak onboarding show elevated early drift. Do you know which locations are losing clients before relationships form - and why?
Proof / Evidence
If you do not want to follow the analysis leading to the conclusions above, you can skip the section below and go straight to the Future Potential section.
How to read the charts below: You don’t need to interpret every line or axis — focus only on the direction and the gap between the average studio and top performers.
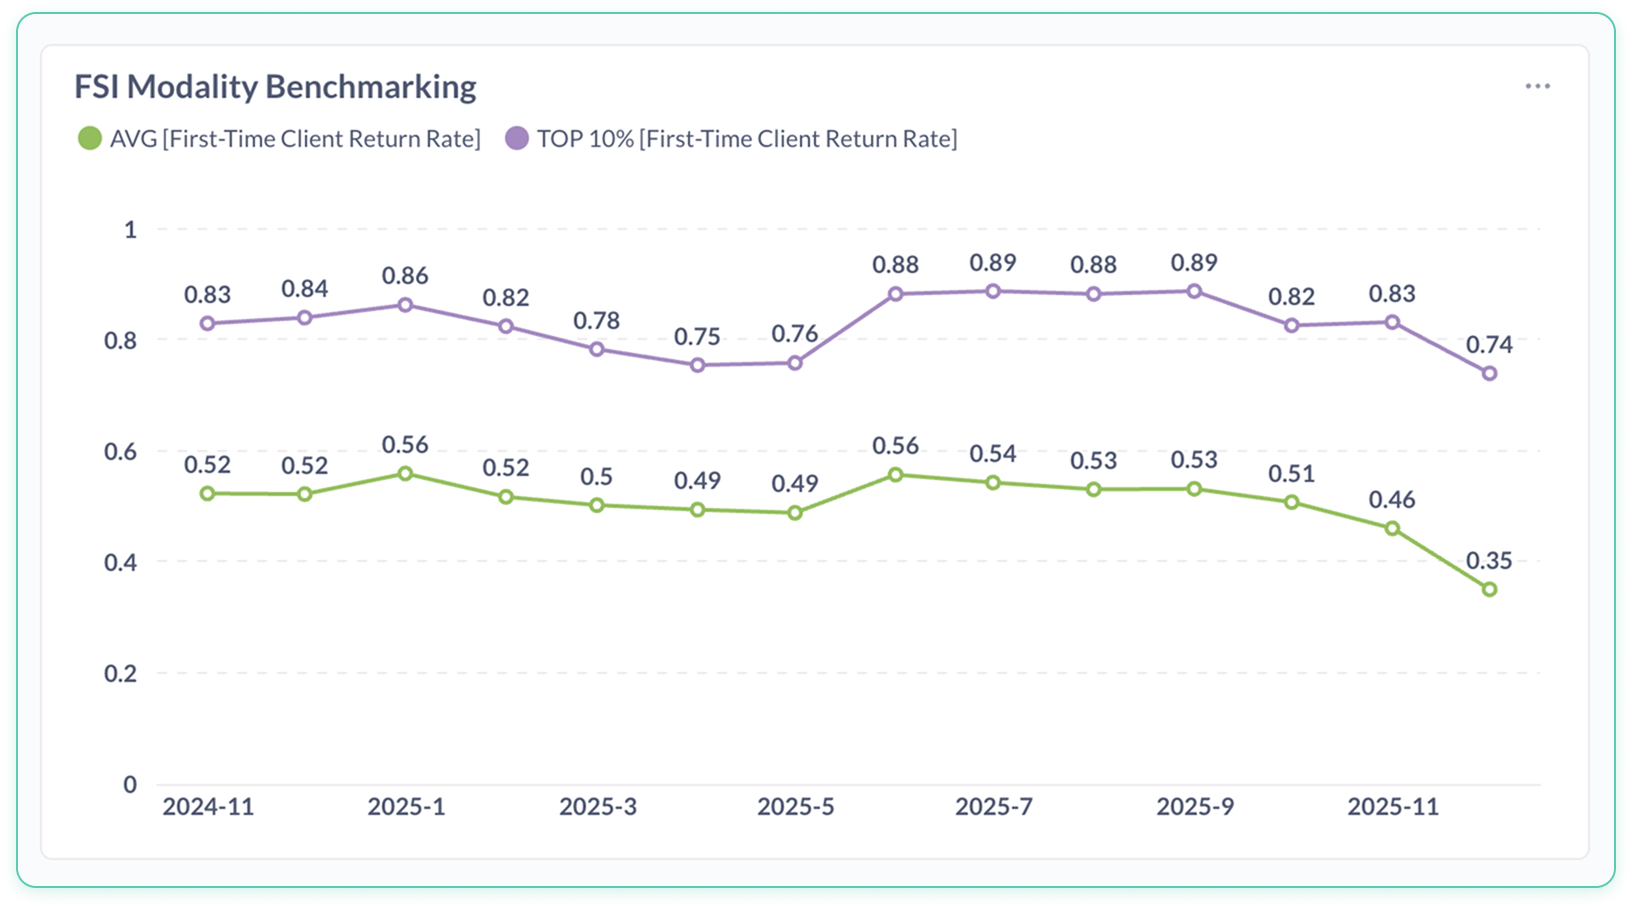
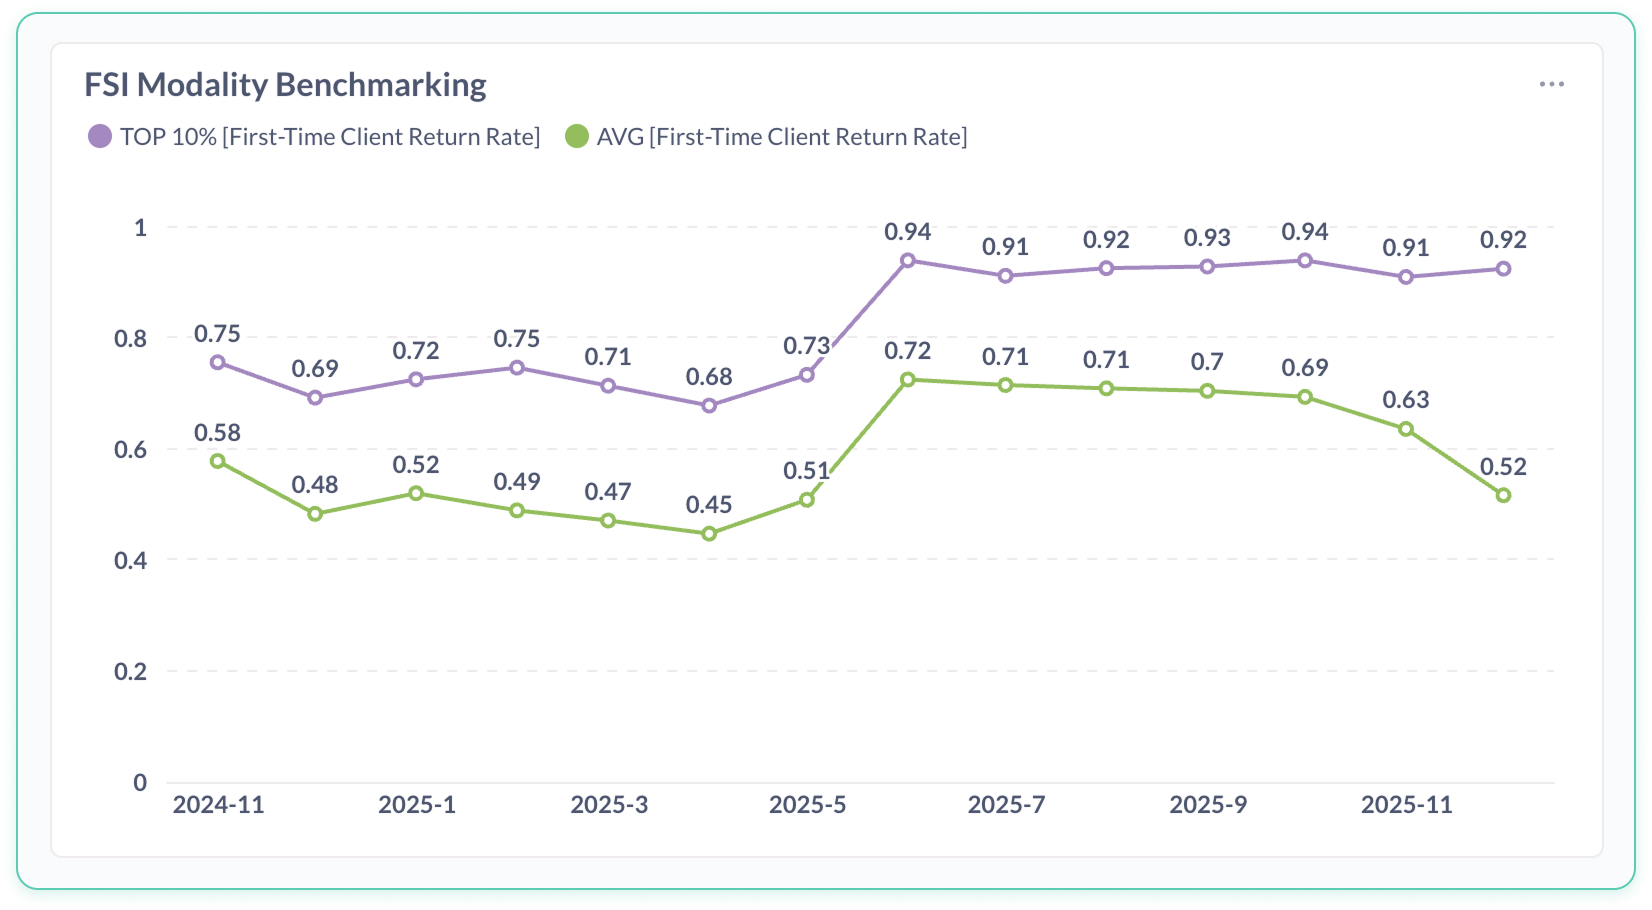
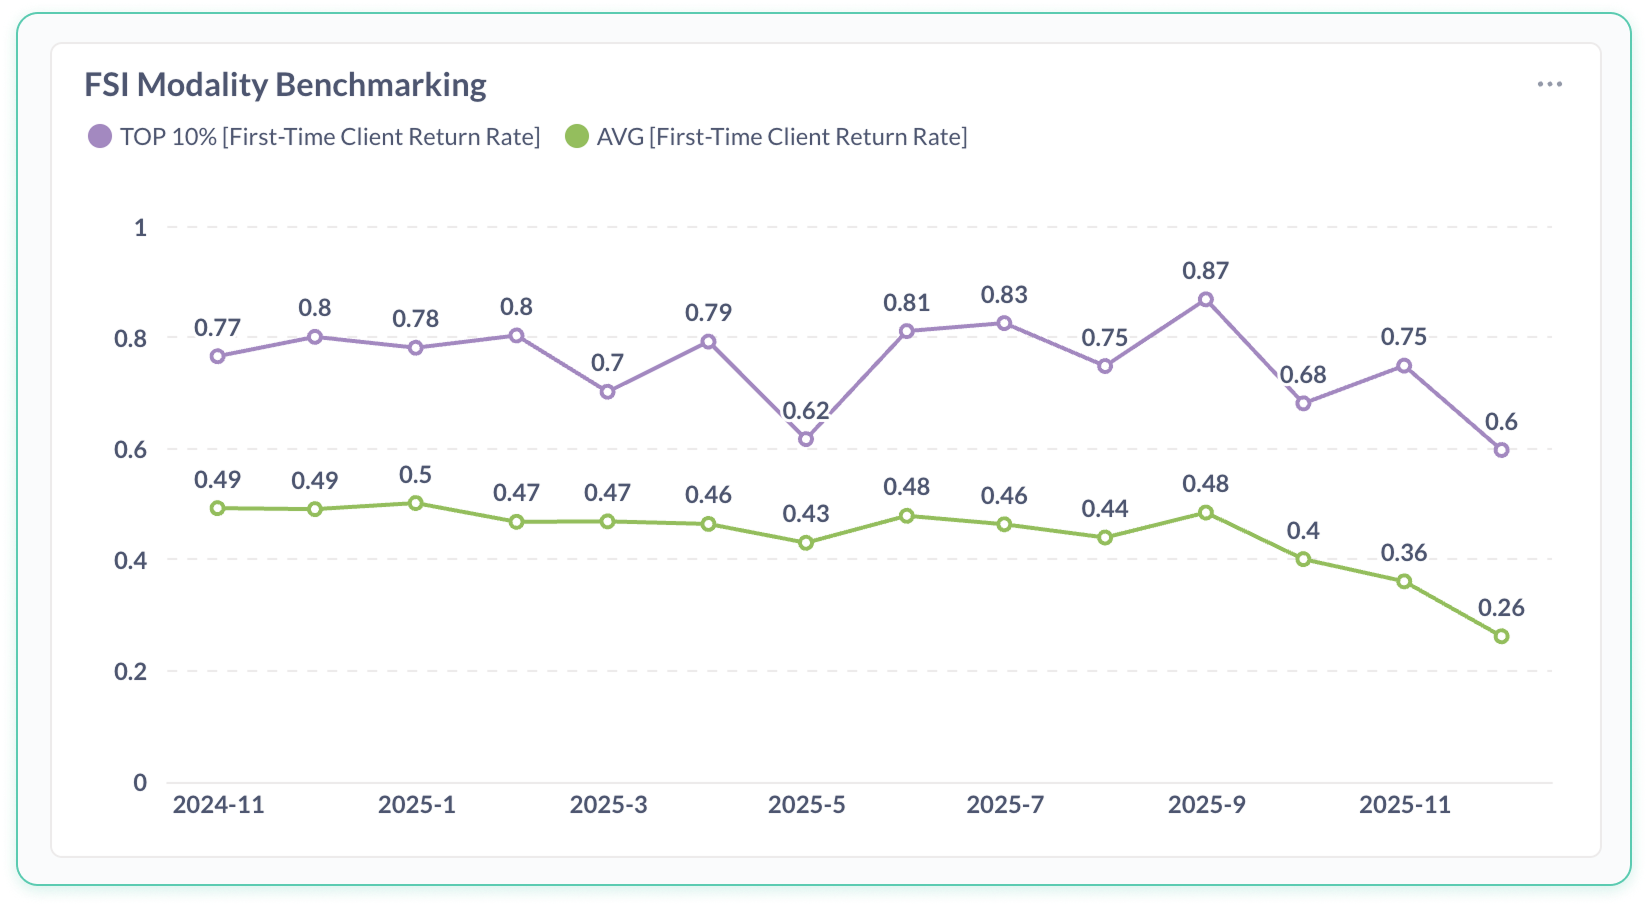
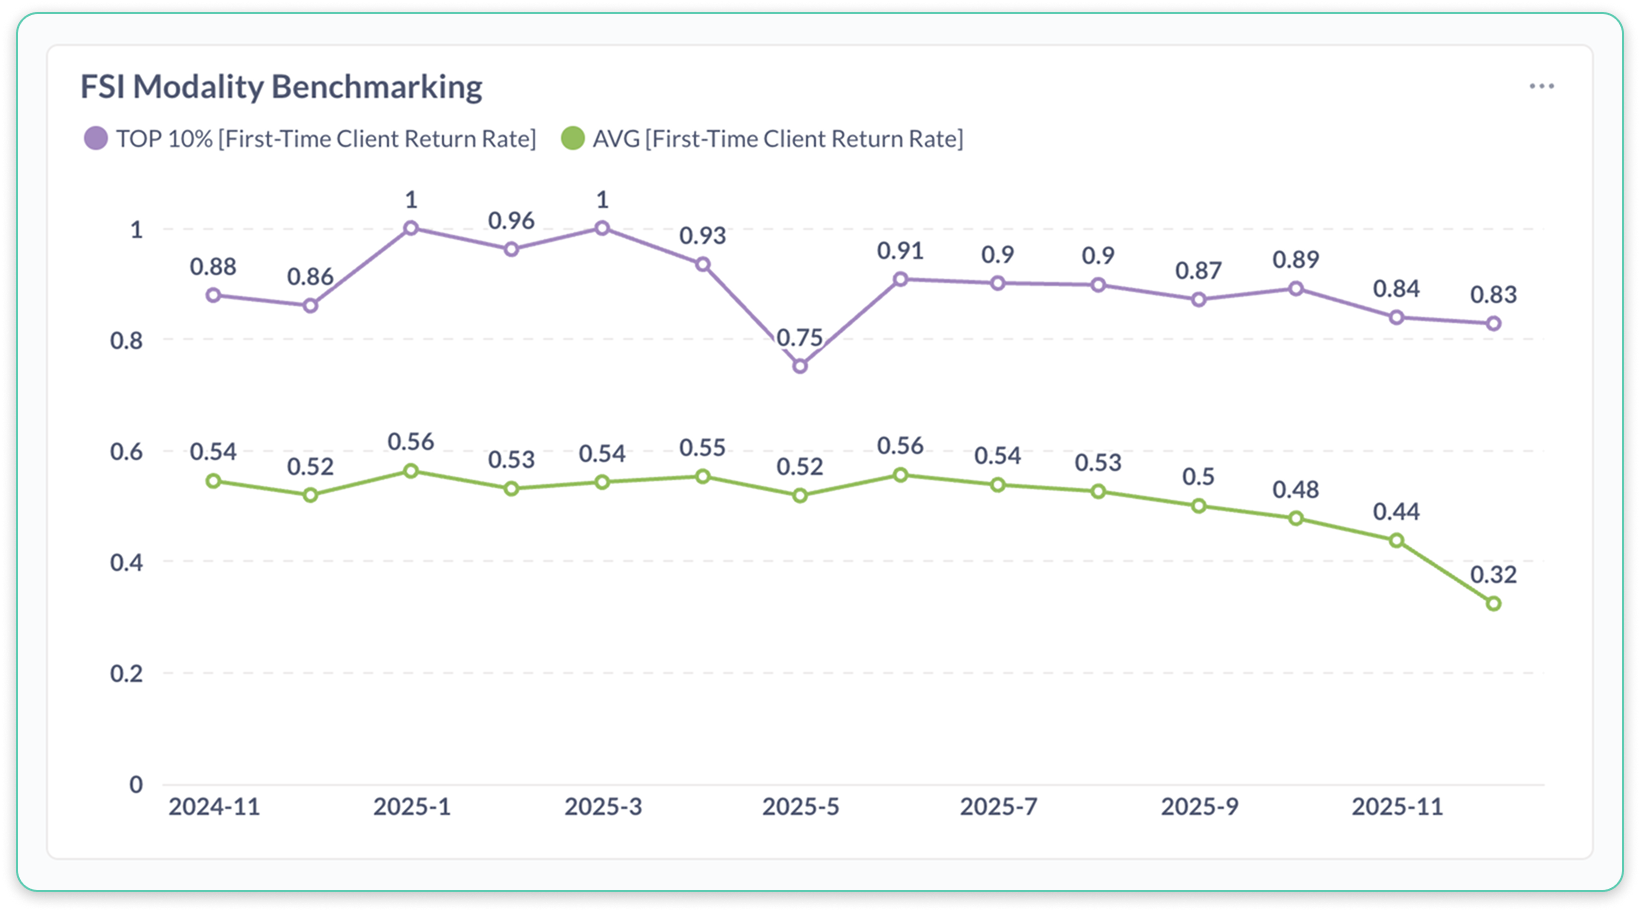
Pilates Benchmarking › First Time Client Return Rate
What matters here: First-time return rates decline meaningfully for the average studio while remaining materially higher for top-decile studios throughout the period.
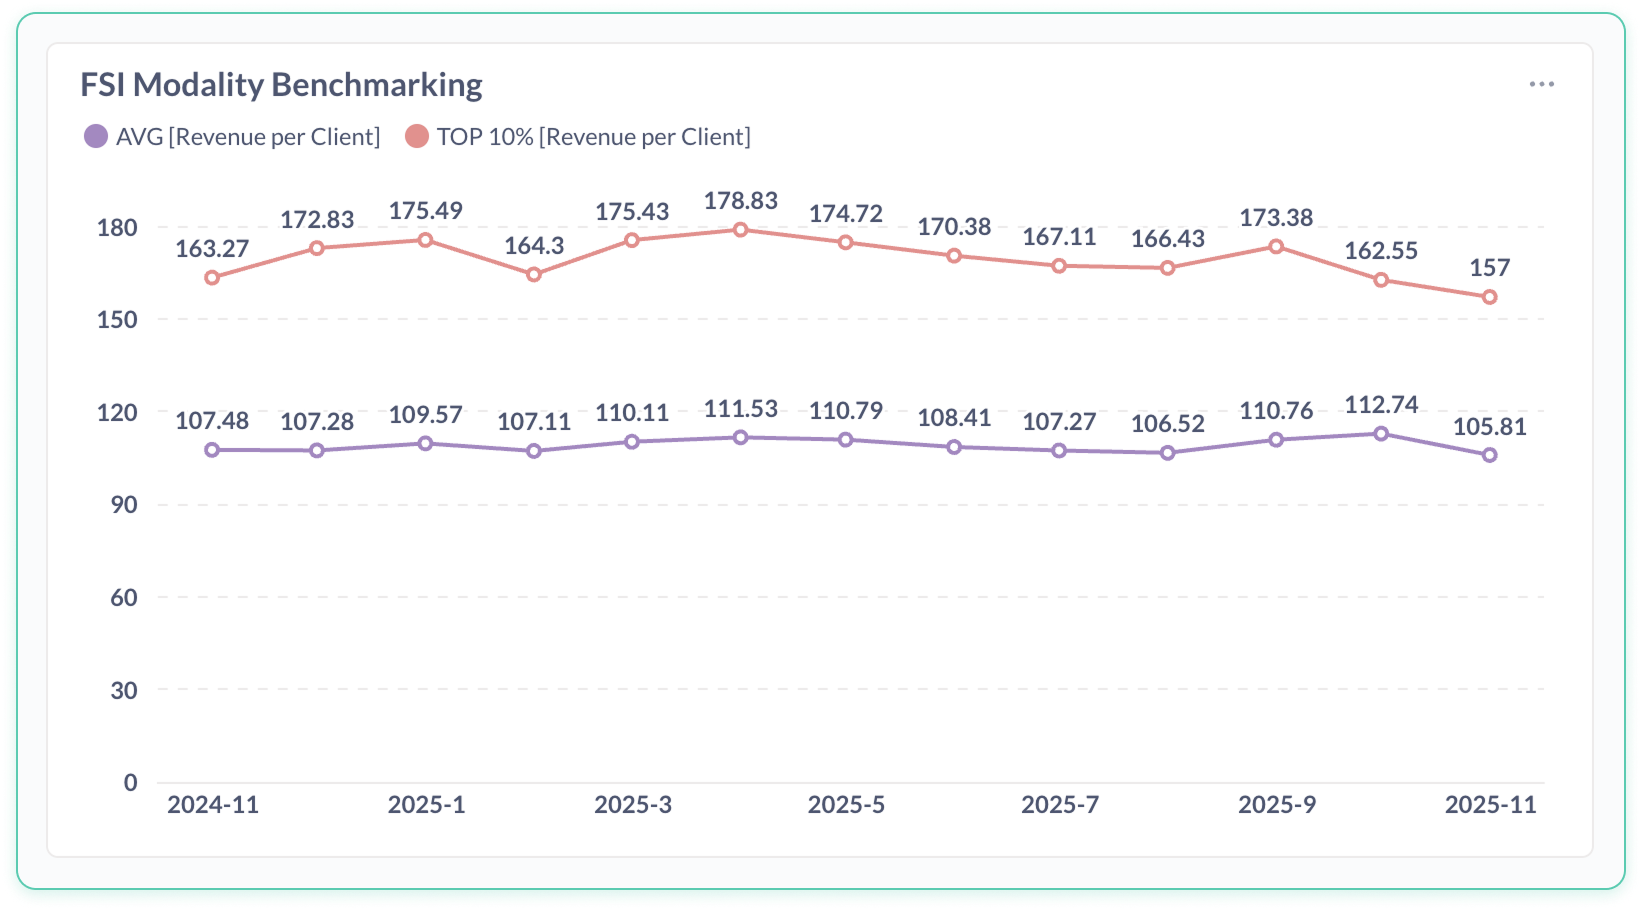
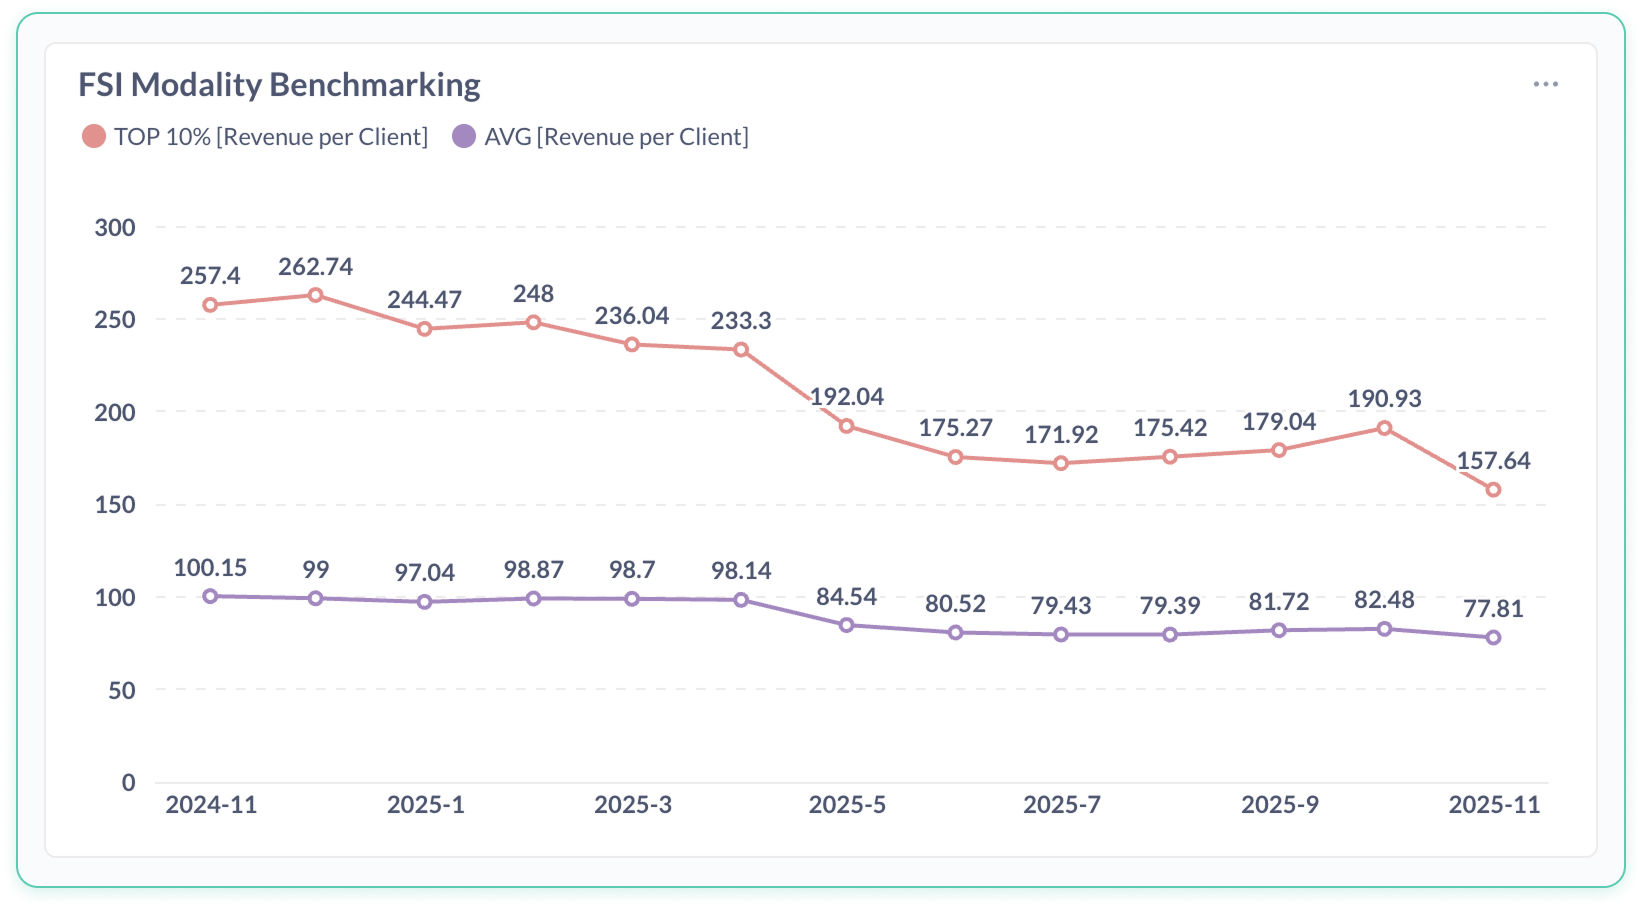
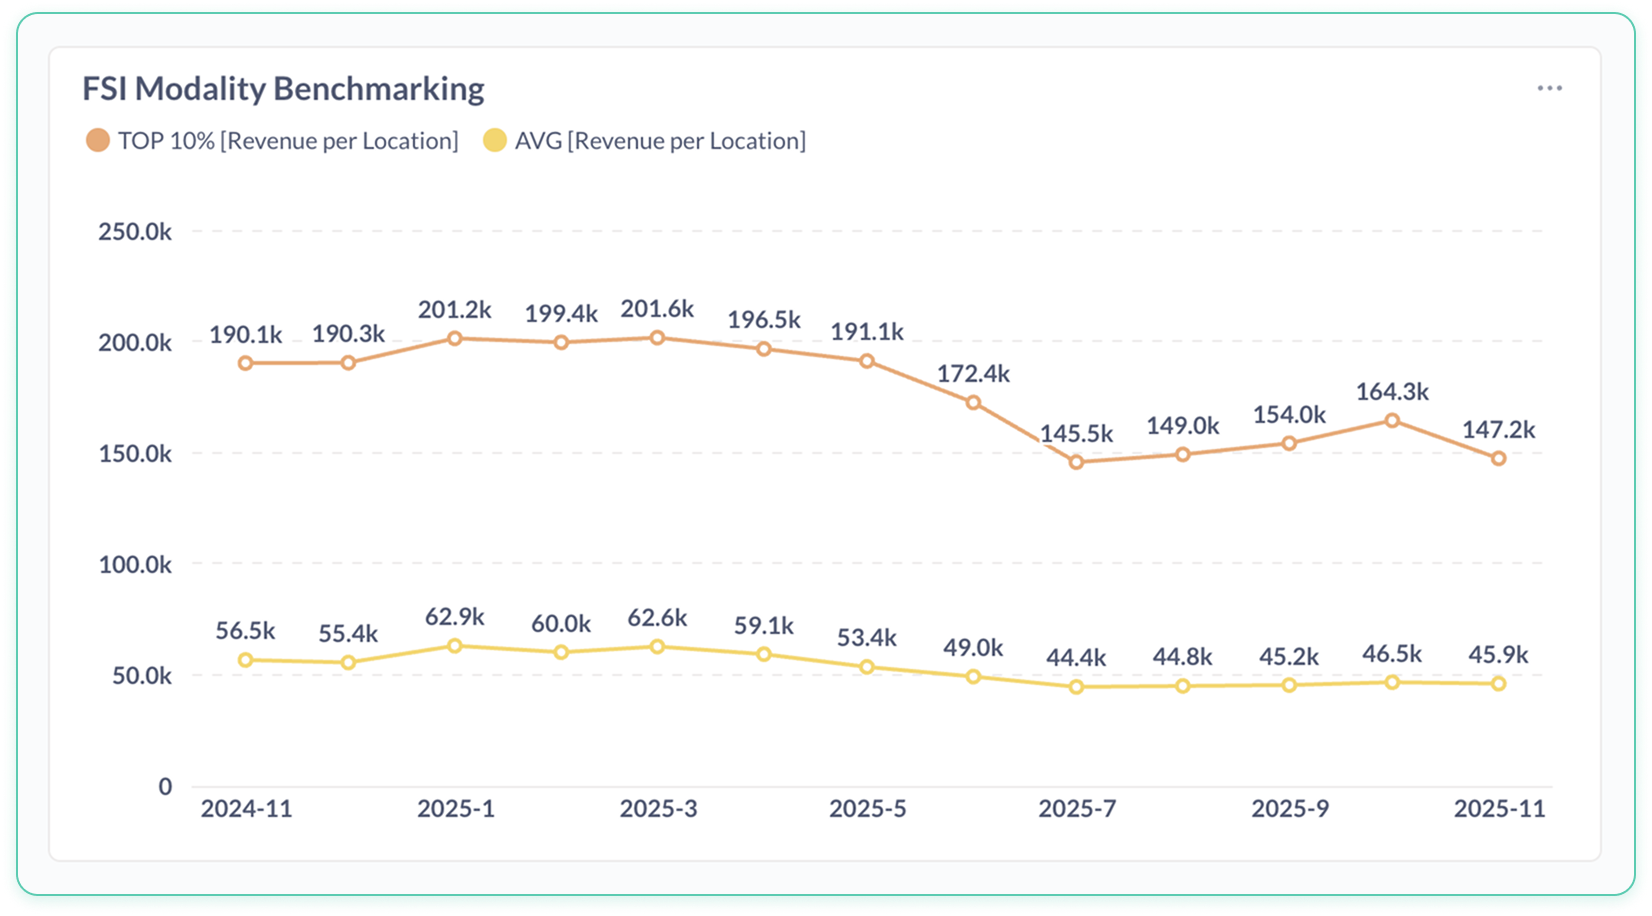
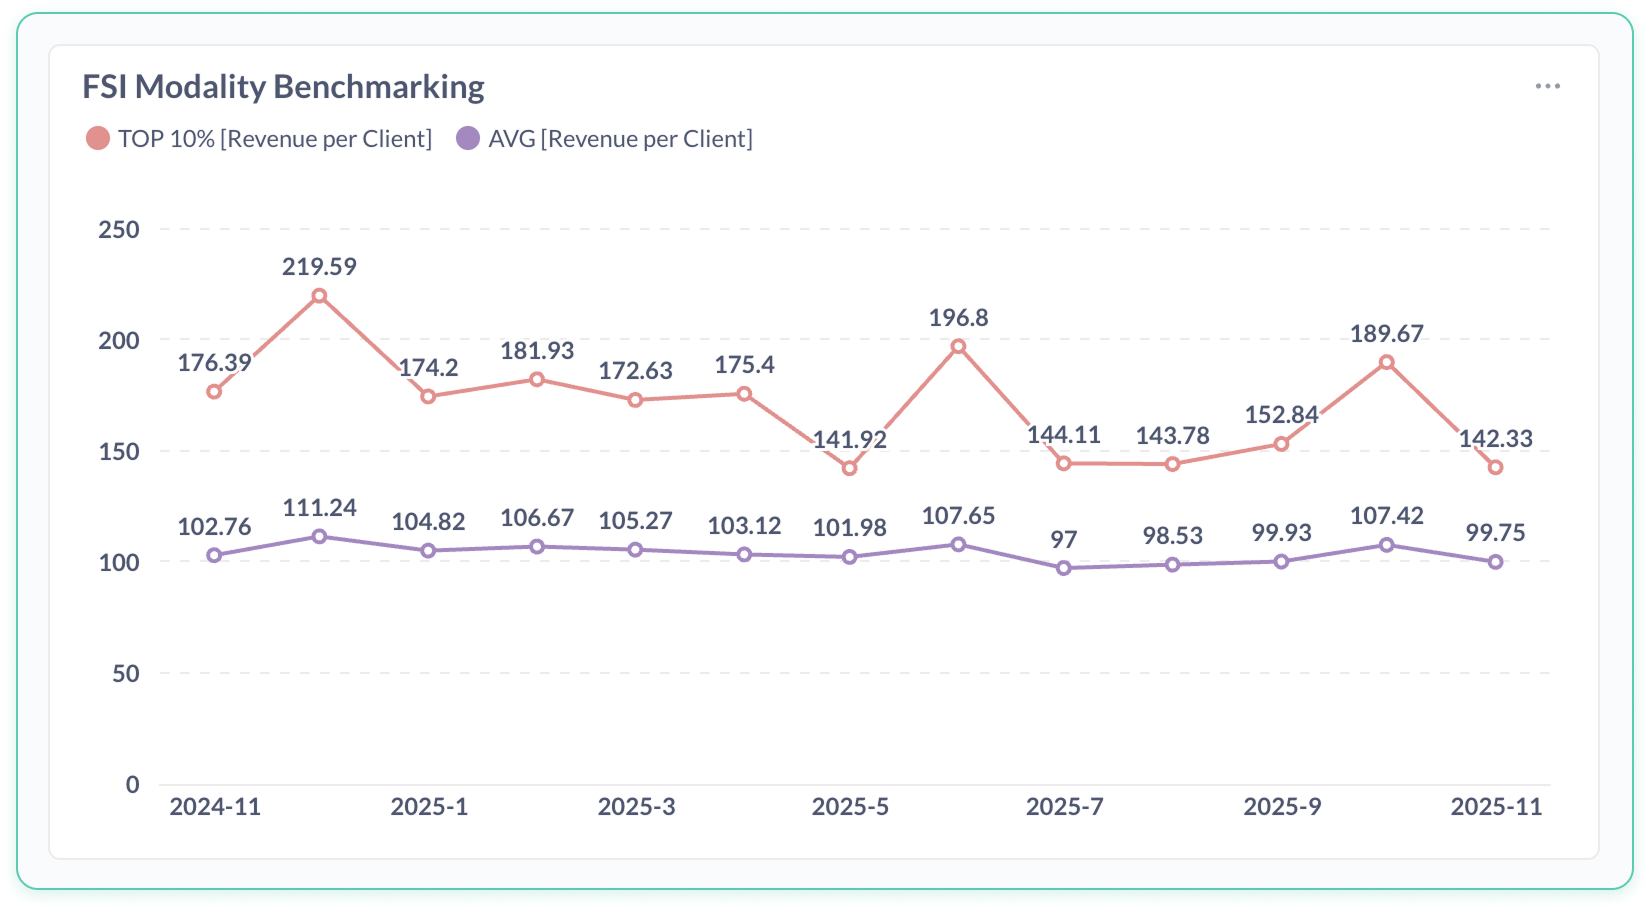
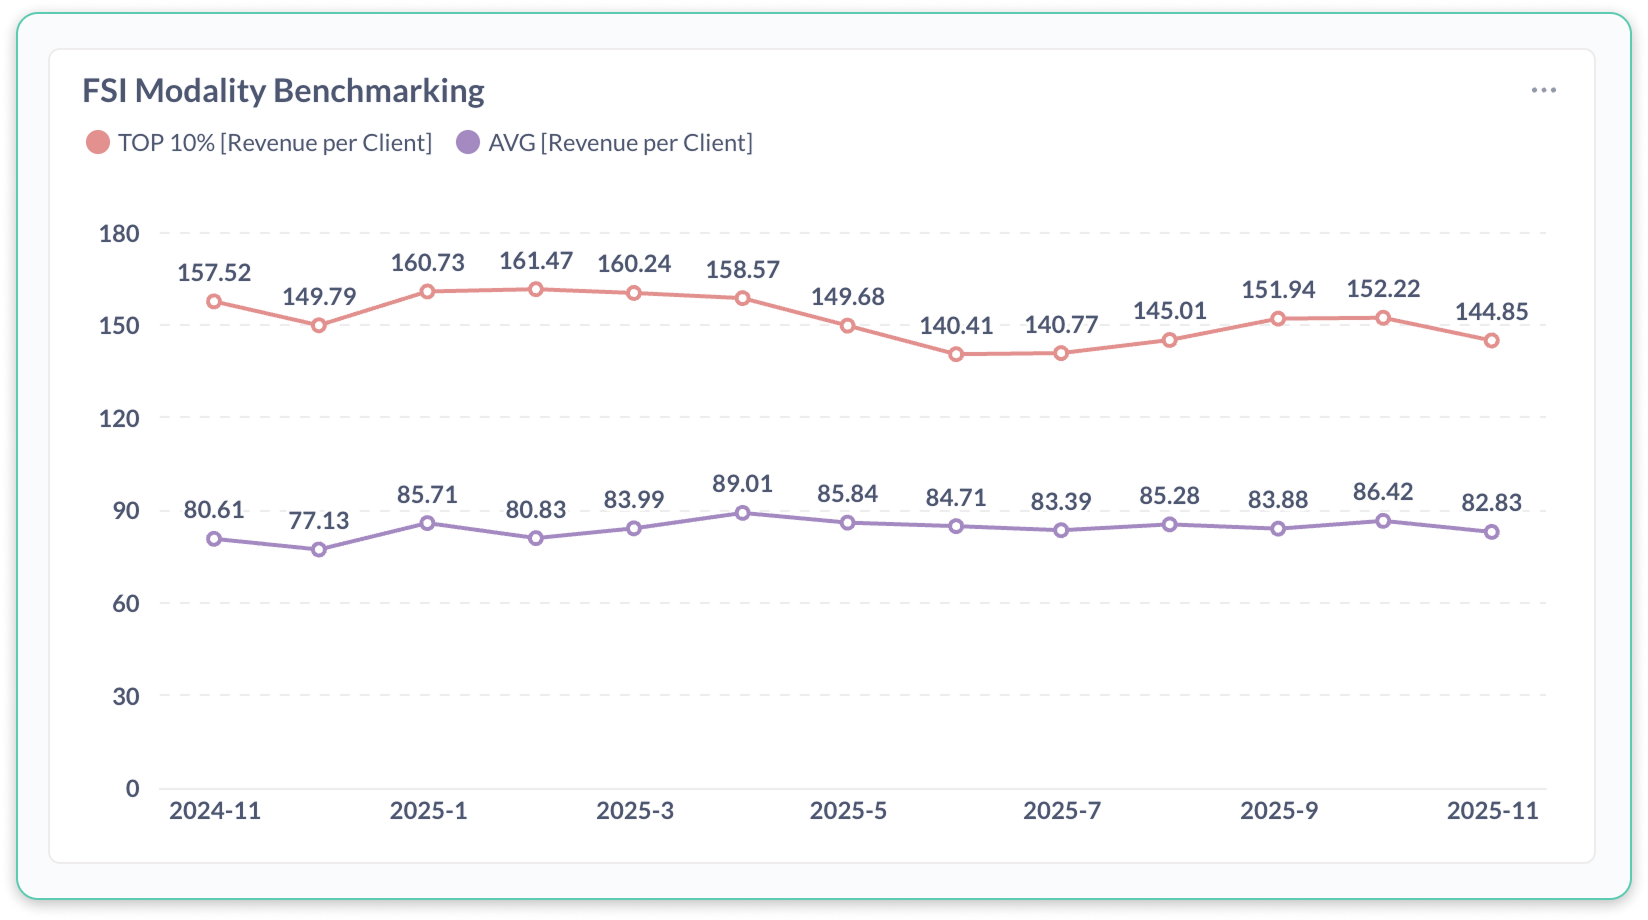
Pilates Benchmarking › Revenue Per Client
What matters here: Revenue per client remains largely flat for both groups, with top-decile studios consistently generating more per client than the average.
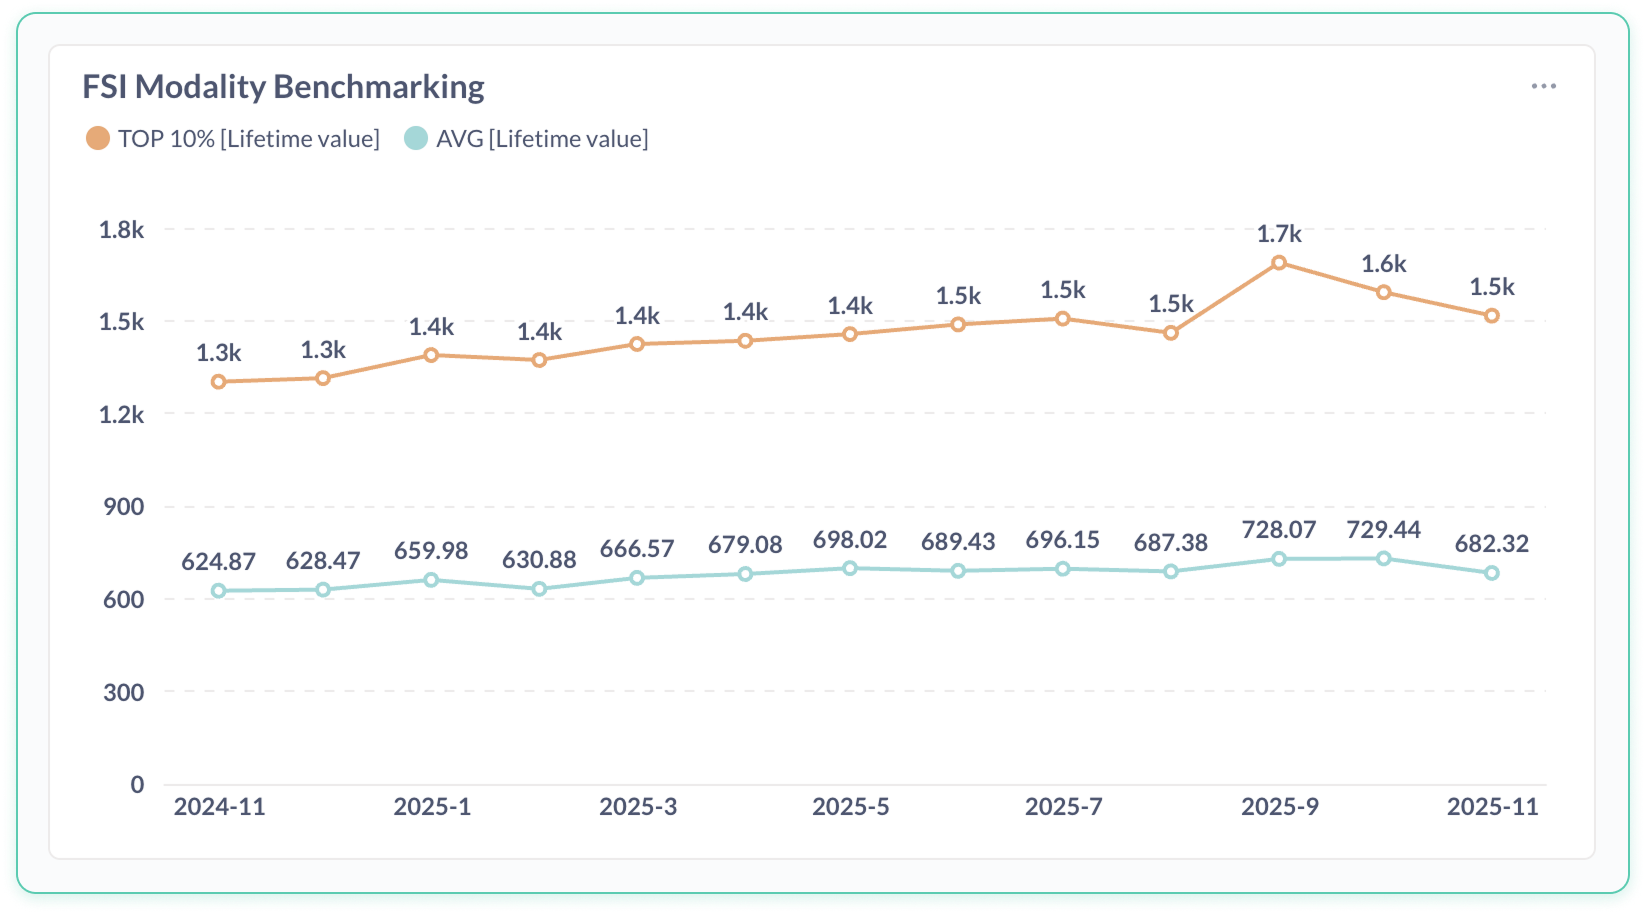
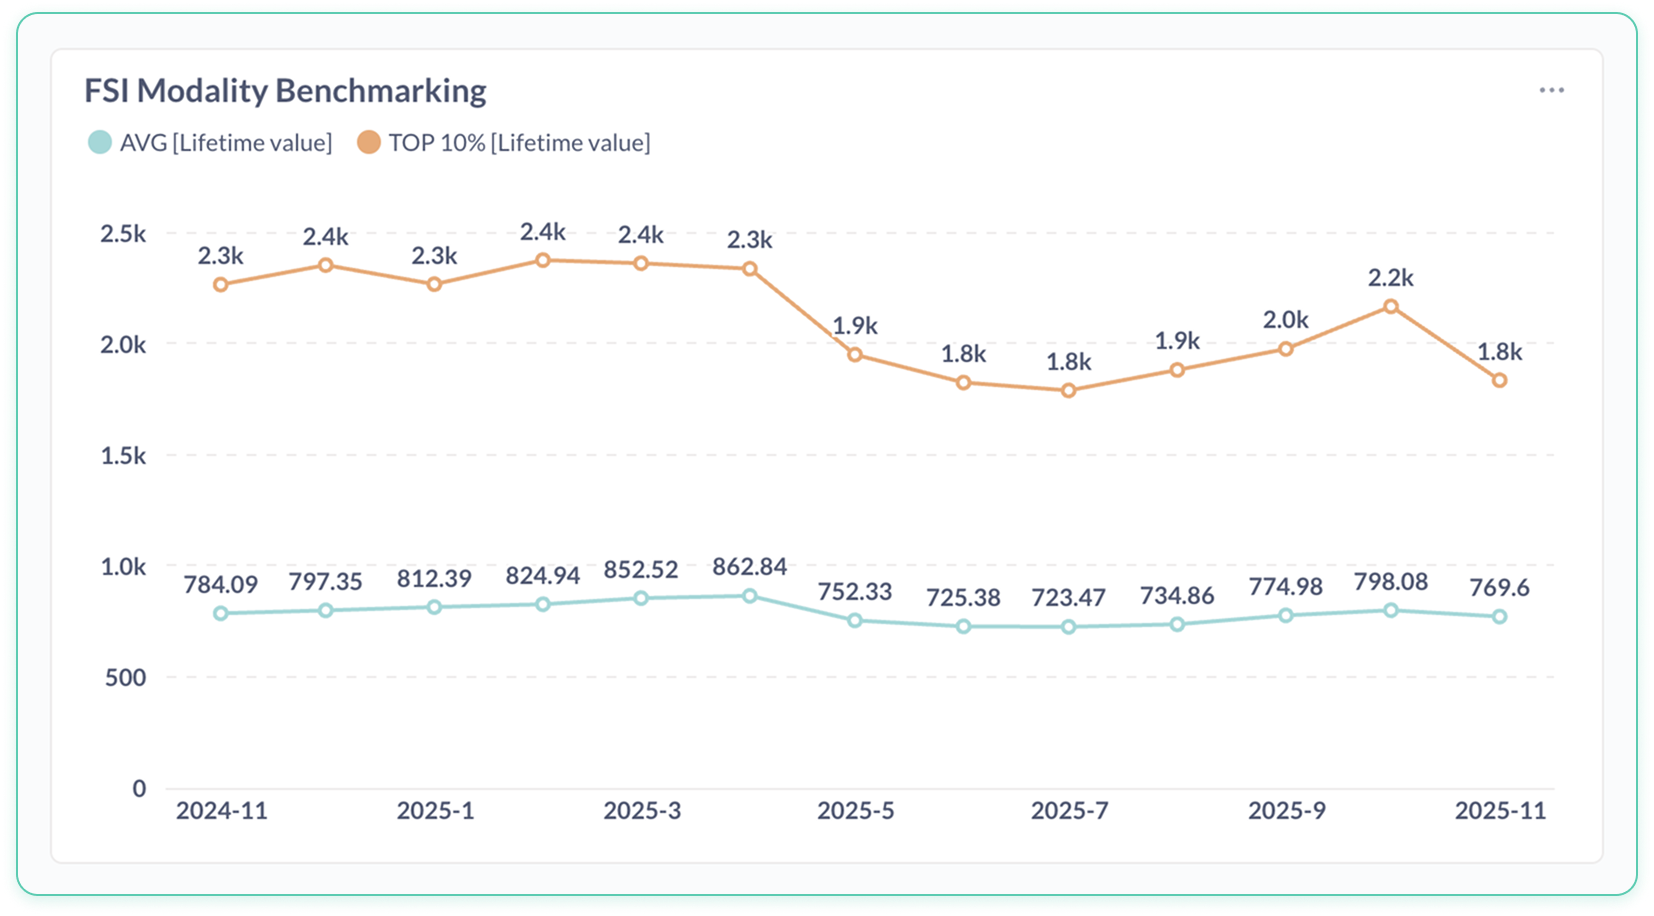
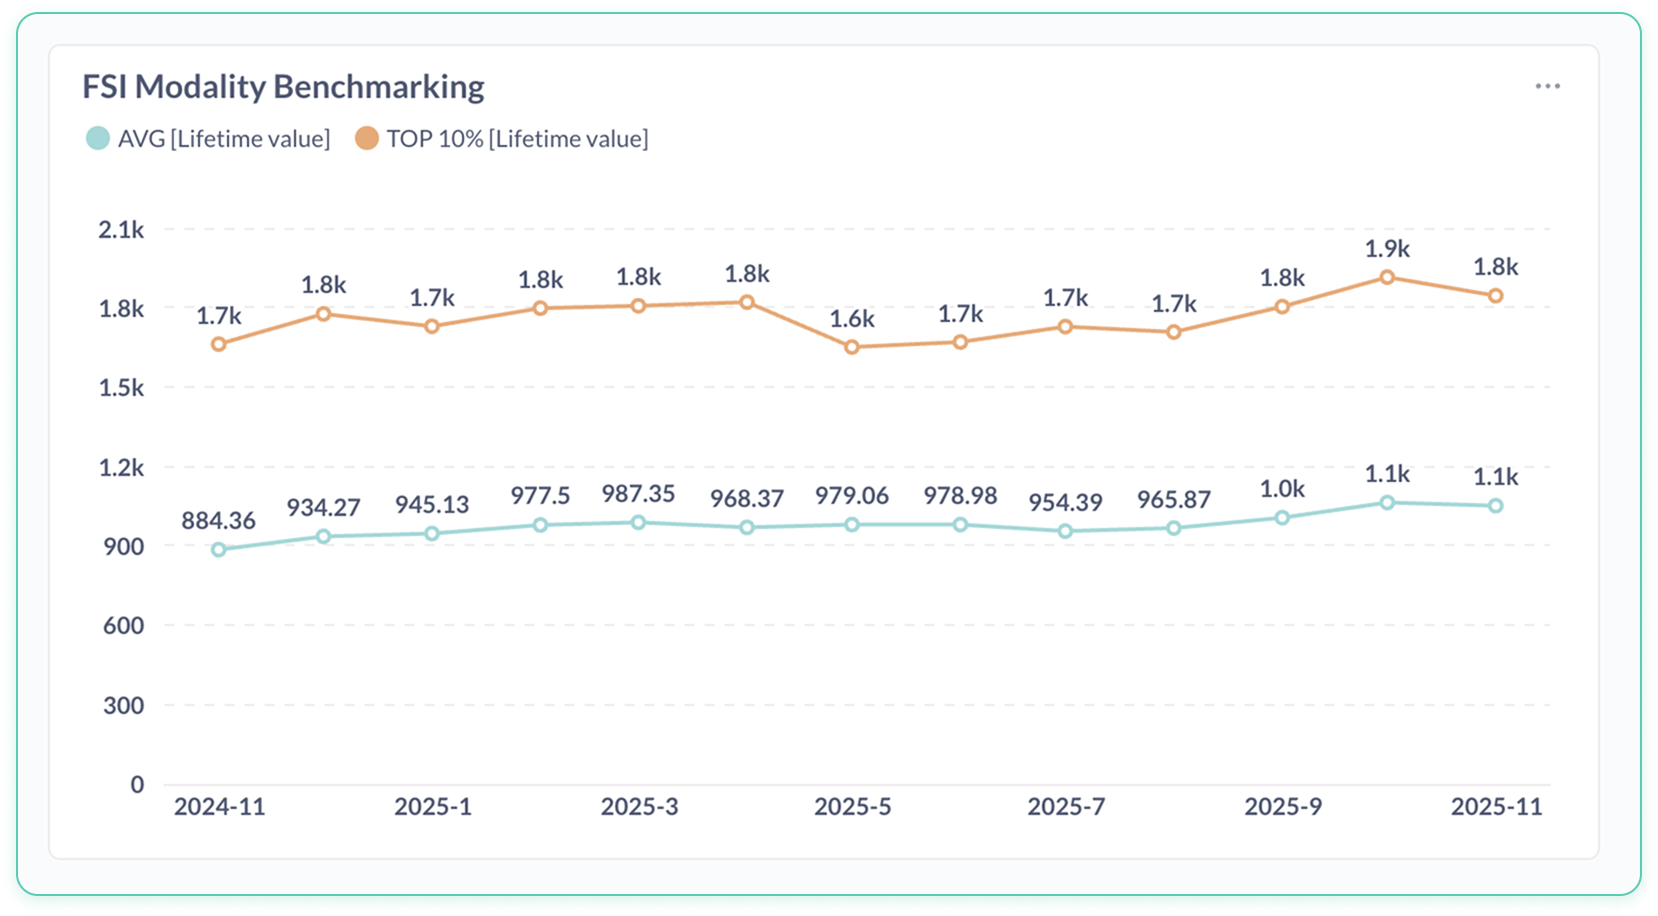
Pilates Benchmarking › Lifetime Value
What matters here: Lifetime value is increasing, overall, and consistently more than double for top-decile studios compared to the average, with no narrowing of the gap over time.
Concept (Pilates)
Early client value can be approximated using a simple proxy.
Note: You don’t need to love math to follow this - it’s just showing how much revenue an average first-timer turns into.
Early Client Value ≈ (First-Time Return Rate) × (Revenue per Client)This represents the expected revenue contribution of an average new client entering the studio.
Bottom line: The front door is where Pilates studios are losing the most money - quietly.
Pilates Calculation
Start of period (average studio)
Return rate ≈ 0.52
Revenue per client ≈ $107
0.52 × $115 ≈ $56
End of period (average studio)
Return rate ≈ 0.46
Revenue per client ≈ $105
0.43 × $115 ≈ $48
Pilates Interpretation
Average new-client economic value decreased ~15-20%.
Top-decile studios avoided this because both components (return rate and monetization) were substantially higher.
Next Modality Analysis: Yoga

Yoga
Strong Start, Weak Mid-Journey Retention
If 1st time experienced feel strong but revenue still isn’t growing, this section shows where the relationship breaks down.
Metrics Used in Analysis
First-Time Return Rate
Revenue per Client
At-Risk Percentage
Lifetime Value
Revenue per Location
Key Yoga Findings
Yoga studios have gotten much better at first impressions - but are losing the relationship afterward.
Many studios now convert first-time visitors well, yet revenue per location has declined because clients don’t stay engaged long enough.
In simple terms: people like the first few classes, but fewer turn into long-term members.
This creates a misleading picture where classes feel healthy, but the business quietly weakens over time.
If this feels familiar, it’s because this pattern already exists in your system.
Studios that build clear paths beyond the intro period - weeks 4 through 12 - retain clients far longer, showing this is a client journey design problem, not a demand problem.
What Yoga Operators Can Do
Create a defined mid-journey plan (weeks 4–12) to reinforce belonging and consistency.
Strengthen community rituals and instructor continuity, the core drivers of long-term yoga retention.
Use at-risk indicators to identify churn signals early before they affect revenue.
Questions for Yoga Operators
Strong intros, weak finish: Yoga excels at first impressions, yet revenue per location is down 25–30 percent. Do you know where the mid-journey experience is breaking?
Rising drift: At-risk percentages are increasing, even in strong studios. Do you know where clients are silently slipping away?
Proof/Evidence
If you do not want to follow the analysis leading to the conclusions above, you can skip the section below and go straight to the Future Potential section.
How to read the charts below: You don’t need to interpret every line or axis — focus only on the direction and the gap between the average studio and top performers.
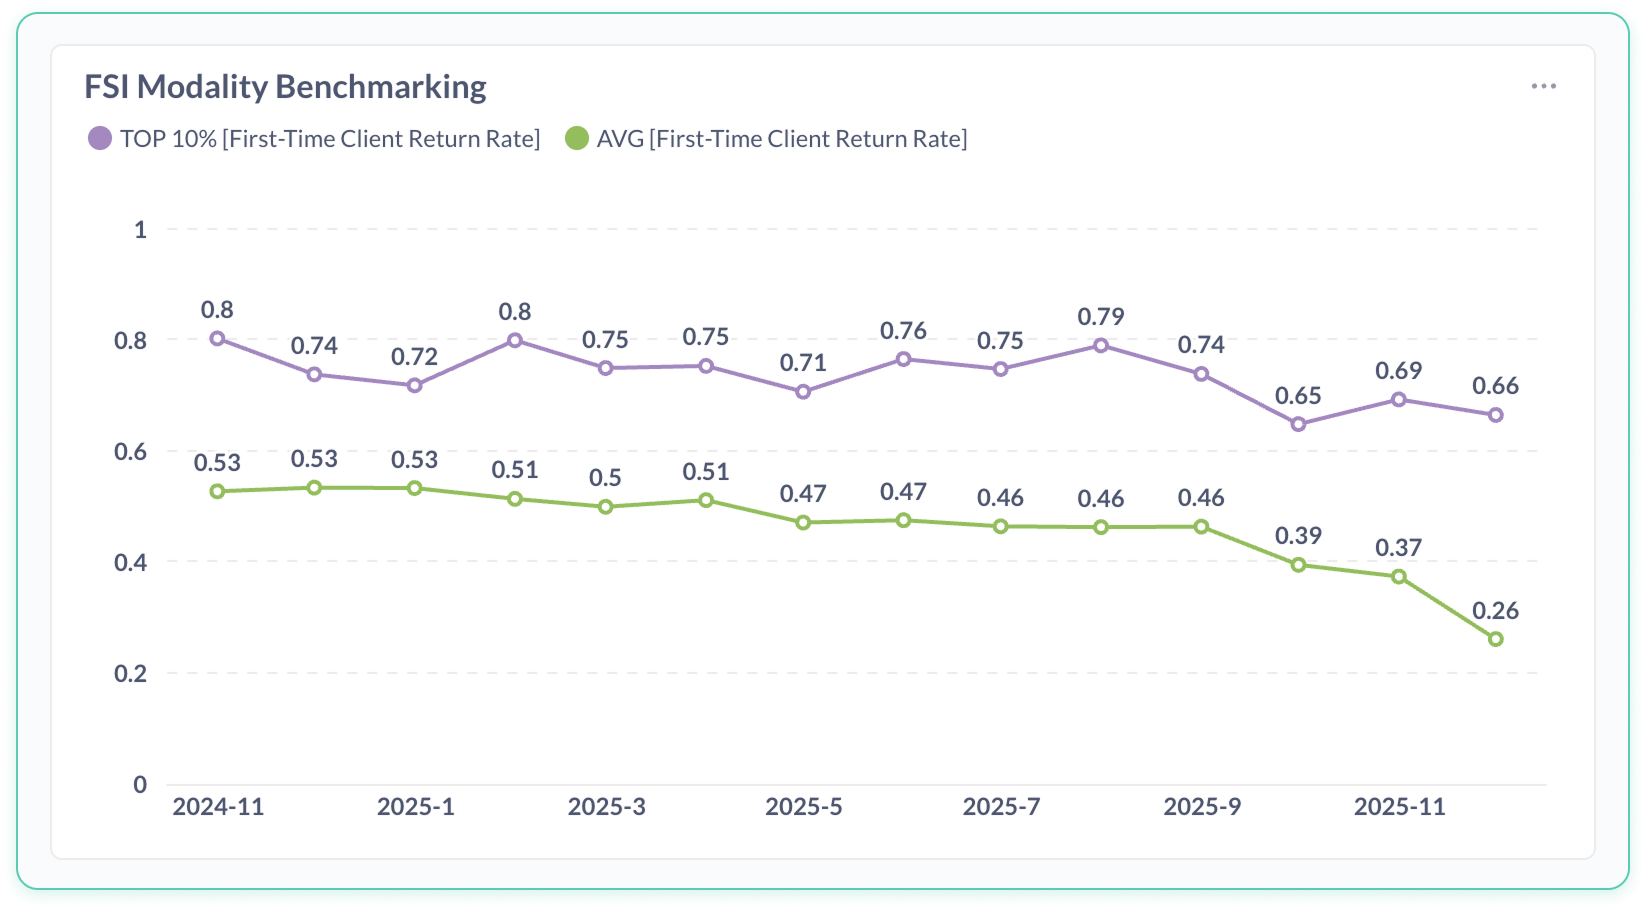
Yoga Benchmarking › First-Time Return Rate
What matters here: First-time return rates are materially higher for top decile studios, with a major jump occurring mid-period. In later months top decile studios maintain their return rates while the average studio declines substantially.
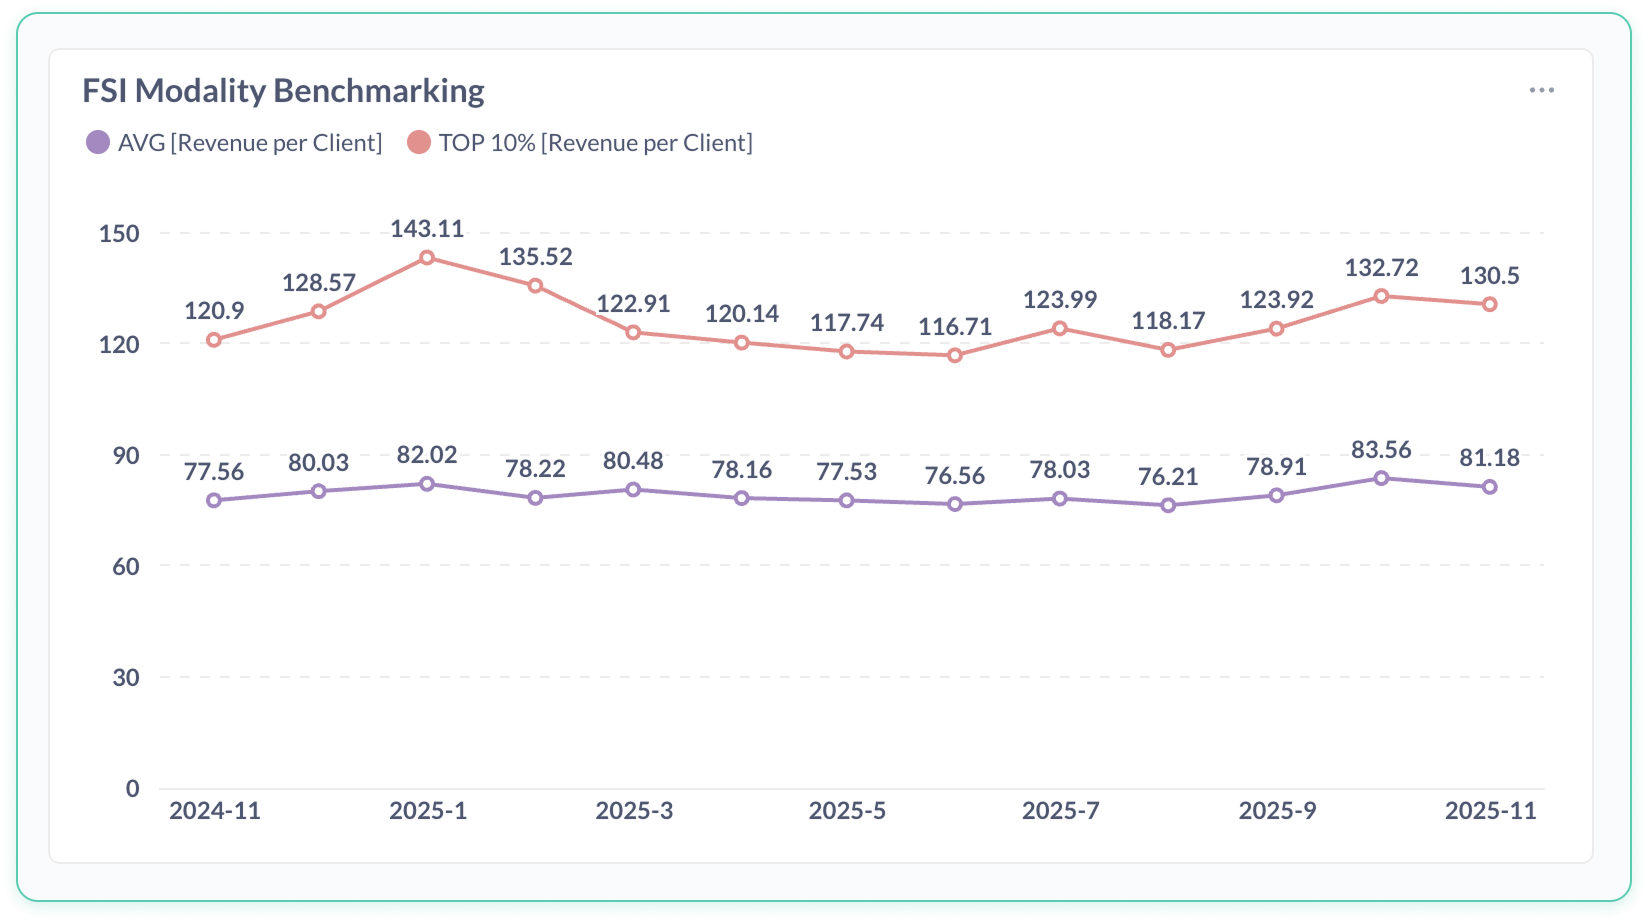
Yoga Benchmarking › Revenue per Client
What matters here: Revenue per client declines by roughly 40% for top-decile studios and 20% for average studios over the period, but still the top decile has roughly double the revenue per client.
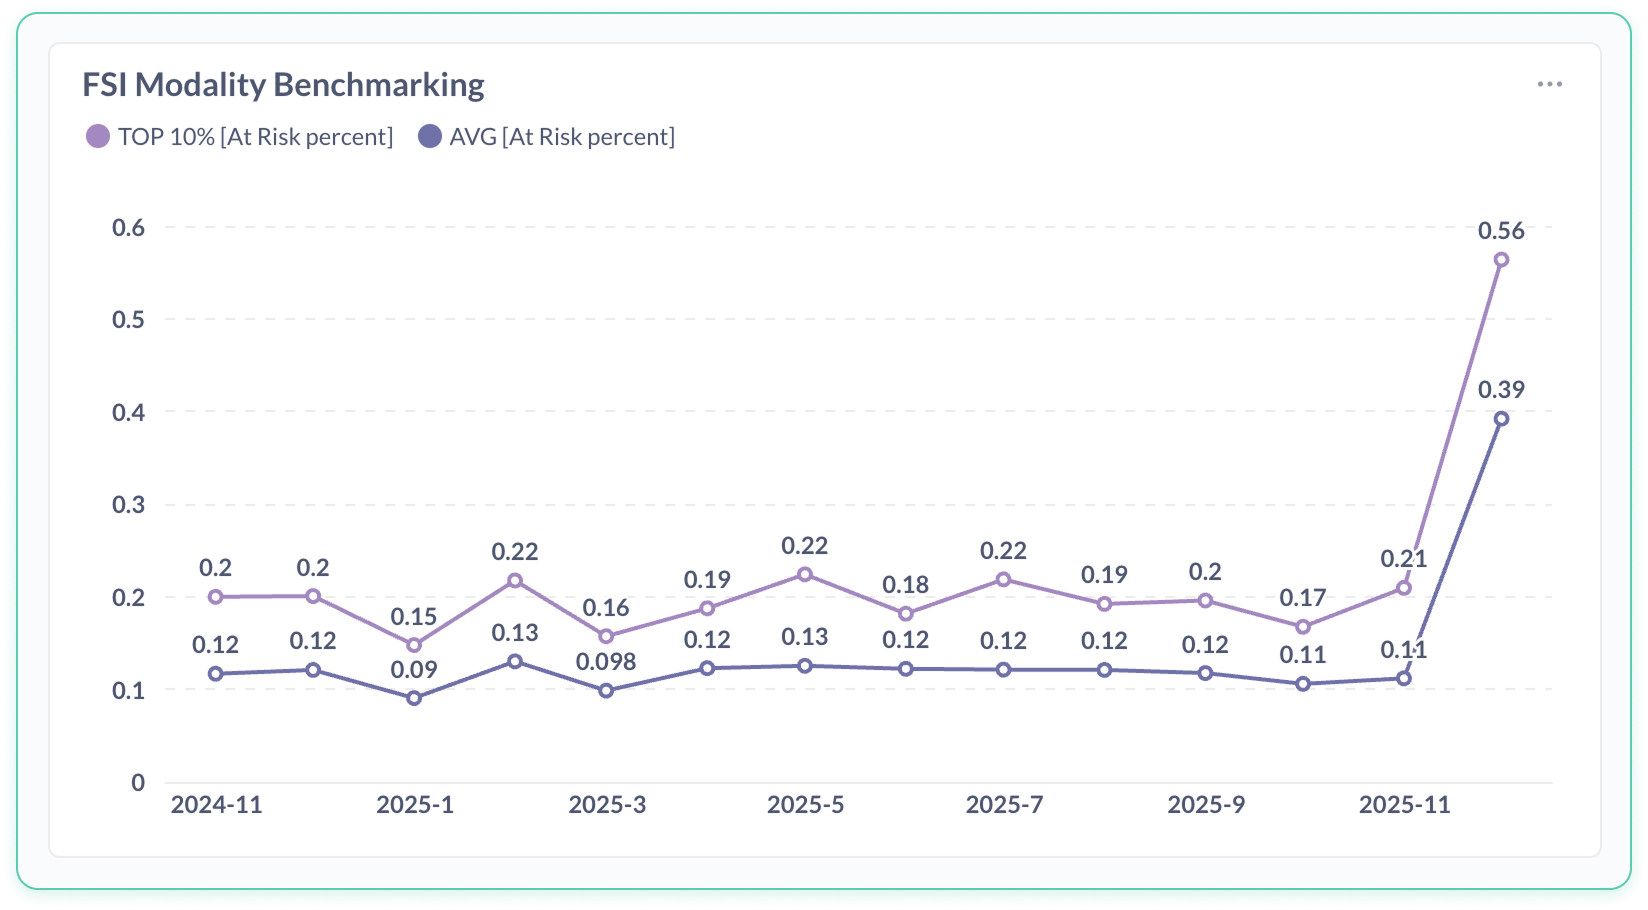
Yoga Benchmarking › At-Risk Percentage
What matters here: The percentage of at-risk clients has remained largely flat for both top decile and average studios. The December 2025 numbers represent a distortion because the data sample was taken mid-month.
Yoga Benchmarking › Lifetime Value
What matters here: Lifetime value for top decile studios has decreased by ~20% while average studios have stayed roughly the same. Still, the top decile is making more than double the amount per client.
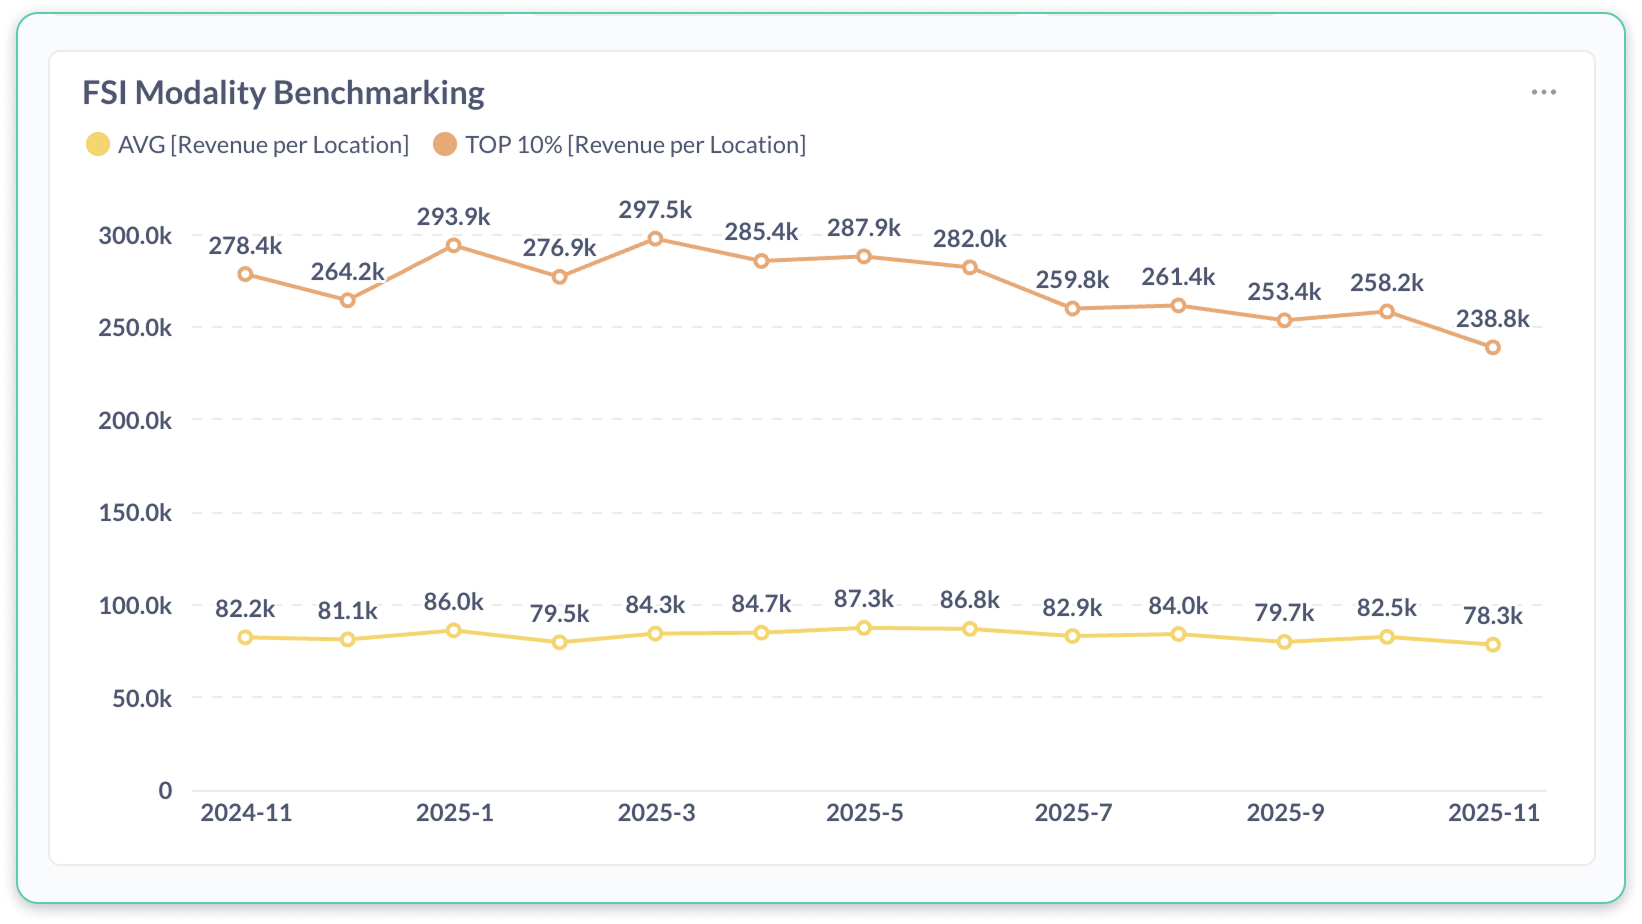
Yoga Benchmarking › Revenue per Location
What matters here: Revenue per location decline ~20% over time for both groups, with top-decile studios bringing in ~3x the amount per location vs th average studio.
Concept (Yoga)
Note: You don’t need to follow the math — this section simply explains why strong first impressions aren’t translating into long-term revenue.
Yoga shows unusually strong front-end performance (high second-visit return rates), yet weakening revenue and rising drift. We compare early value trends with mid-journey risk indicators.
Yoga Observation
First-time return rates among top performers often range between 70–90%.
Revenue per location decreased roughly 25–30%.
At-Risk % increased despite strong early return rates
Yoga Interpretation
The early journey (visits 1–3) is functioning well, but the mid-journey (weeks 4–12) is breaking, reducing total revenue even when front-end performance improves.
Next Modality Analysis: Barre

Barre
Loyalist Concentration
If your business is increasingly carried by a small group of loyal regulars, this section explains why that’s risky - and fixable.
Metrics Used
First-Time Return Rate
Revenue per Client
Lifetime Value
Key Barre Findings
Barre studios are increasingly being carried by a small group of loyal regulars.
New clients are sticking around 10–15% less than they used to, meaning future growth depends more and more on the same familiar faces.
In other words: the back of the room is strong, but the front of the funnel is thinning.
This is risky. When loyalists move, age out, or burn out, there aren’t enough new clients behind them to replace the revenue.
If this feels familiar, it’s because this pattern already exists in your system.
Studios that intentionally recreate the emotional “hook” of loyal clients during the first few visits reverse this trend - proving the issue is early experience execution, not brand appeal.
What Barre Operators Can Do
Reproduce the emotional experience loyalists feel within the first three visits.
Train staff and instructors to deliver intentional early “connection moments” for new clients.
Treat declining early-retention metrics as leading indicators of long-term revenue erosion.
Questions for Barre Operators
Loyalist dependence: Barre’s growth is carried by a shrinking base of loyalists, while new-client early value declines. Do you know how reliant your system is on a small subset of clients?
Early experience inconsistency: Top studios convert new visitors at much higher rates. Do you know whether your brand experience is consistent in the first five visits?
Proof/Evidence
If you do not want to follow the analysis leading to the conclusions above, you can skip the section below and go straight to the Future Potential section.
How to read the charts below: You don’t need to interpret every line or axis — focus only on the direction and the gap between the average studio and top performers.
Barre Benchmarking › First-Time Return Rate
What matters here: First-time return rates have declined for both top decile and average studios with the magnitude of the drop far greater for average studios (~50% for average vs ~20% for top decile).
Barre Benchmarking › Revenue per Client
What matters here: Revenue per client has been stable in the average studio but decline by ~20% in top decile studios, though the top decile drive ~43% more revenue per client.
Barre Benchmarking › Lifetime Value
What matters here: Lifetime value increases over time for both groups, but the gap between top-decile studios and the average remains wide.
Concept (Barre)
Note: You don’t need to follow the math — this just shows whether new clients are becoming loyal clients, or whether revenue is coming from the same familiar faces.
We compare early-client value to overall LTV growth to determine whether improvements are driven by new clients or existing loyalists.
Early Value Proxy
Early Value ≈ Return Rate × Revenue per ClientCalculation
Earlier period
Return rate ≈ 0.62
Revenue per client ≈ $110
0.62 × $110 ≈ $68
Later period
Return rate ≈ 0.54
Revenue per client ≈ $110
0.54 × $110 ≈ $59
Interpretation
Early value declined ~10–15%, but overall LTV rose from ~$850 to ~$1,100–$1,200.
This means loyalists are becoming more valuable while new clients are becoming less likely to join them.
Next Modality Analysis: HIIT/Bootcamp

HIIT / Bootcamp
Rising LTV, Declining Capacity
If your best members spend more but rooms aren’t fuller, this section explains why strong loyalty isn’t translating into stronger unit economics.
Metrics Used
First-Time Return Rate
Revenue per Client
Lifetime Value
Revenue per Location
Key HIIT/Bootcamp Findings
HIIT studios have built extremely valuable members - but are running emptier rooms.
The clients who stay are spending more and staying longer, yet revenue per location is down because fewer people are in each class.
This creates a dangerous illusion: strong loyalty masks declining utilization.
Think of it as running a great restaurant with fewer tables filled - even if the guests who show up order more, total revenue suffers.
If this feels familiar, it’s because this pattern already exists in your system.
Studios that optimize class timing, capacity, and onboarding into peak sessions fill rooms again - showing this is a utilization problem, not a product problem.
What HIIT/Bootcamp Operators Can Do
Audit and optimize class times to reduce low-attendance blocks and strengthen peak periods.
Funnel new clients into your highest-performing class times to accelerate conversion.
Track conversion and utilization together as one unified performance score.
Questions for HIIT/Bootcamp Operators
Utilization mismatch: Lifetime value is rising but rooms are 20–25 percent emptier. Do you know which locations are materially under-utilized - and why?
Wide variance: Utilization varies dramatically across studios in the same brand. Do you know how much variance exists across your system and what it is costing you?
Proof/Evidence
If you do not want to follow the analysis leading to the conclusions above, you can skip the section below and go straight to the Future Potential section.
How to read the charts below: You don’t need to interpret every line or axis — focus only on the direction and the gap between the average studio and top performers.
HIIT/Bootcamp › First-Time Return Rate
What matters here: First-time return rates fall substantially for the average studio (and continue to fall) while remaining relatively stable (though slight decline) for the top decile.
HIIT/Bootcamp › Revenue per Client
What matters here: Revenue per client for declines by ~10% for the top decile while remaining relatively flat for the average studio. Still, the top decile brings in ~70% more per client than the average studio.
HIIT/Bootcamp › Lifetime Value
What matters here: Lifetime value rises steadily for both top-decile and average studios with top decile studios making more than 2x the amount per client, over time.
HIIT/Bootcamp › Revenue per Location
What matters here: Revenue per location peaks mid-period and then declines by roughly 20–25% for both groups, despite top-decile studios remaining higher.
Concept (HIIT/Bootcamp)
Note: You don’t need to follow the math — this simply explains why studios can have great members but still earn less per location.
We examine the relationship between per-client economics and per-location economics. If client-level metrics rise while location-level revenue falls, the constraint must be in capacity (attendance volume).
Observation
LTV increased from ~1.6k to ~1.9k
Revenue per client rose
Revenue per location declined from ~320k to ~255k
Interpretation
Clients who remain are more valuable, but there are fewer of them—indicating under-utilization of rooms, not weakening product quality.
Next Modality Analysis: Cycling
Cycling
Front-End Decline & Instructor Fragility
If your studio feels busy but growth feels capped, this section shows how early drop-off and instructor dependencies are holding the modality back.
Metrics Used
First-Time Return Behavior
Revenue per Client
Revenue per Instructor
Lifetime Value
Key Cycling Findings
Cycling isn’t dead - but its front door is broken.
The average new cycling client is now worth 30–35% less than last year, because far fewer first-timers return after their first or second ride.
At the same time, revenue is increasingly driven by a small number of star instructors, making studios fragile when schedules change or instructors leave.
So while classes may feel busy, the business underneath is narrowing.
If this feels familiar, it’s because this pattern already exists in your system.
Studios that fix the first two rides and spread top-instructor behaviors across the team stabilize revenue - proving cycling’s challenge is execution and consistency, not interest.
What Cycling Operators Can Do
Redesign the first two rides as a guided conversion arc rather than simple schedule slots.
Observe your top instructors, document what they do differently, and replicate those behaviors system-wide.
Use revenue-per-instructor and retention data to reduce dependence on a small number of heroes.
Questions for Cycling Operators
Front-end collapse: New-client value has fallen roughly 33 percent. Do you know where conversion and early engagement are breaking?
Hero-instructor dependence: Revenue depends disproportionately on a few instructors. Do you know how fragile or scalable your instructor model is?
Proof/Evidence
If you do not want to follow the analysis leading to the conclusions above, you can skip the section below and go straight to the Future Potential section.
How to read the charts below: You don’t need to interpret every line or axis — focus only on the direction and the gap between the average studio and top performers.
Cycling Benchmarking › First-Time Return Rate
What matters here: Despite declines in first-time return rates for both average and top decile studios, the decrease in average studios is much sharper (50% vs 20%)
Cycling Benchmarking › Revenue per Client
What matters here: Revenue per client has increased slightly for both average and top decile studios with top decile studios bringing in ~60% more than the average.
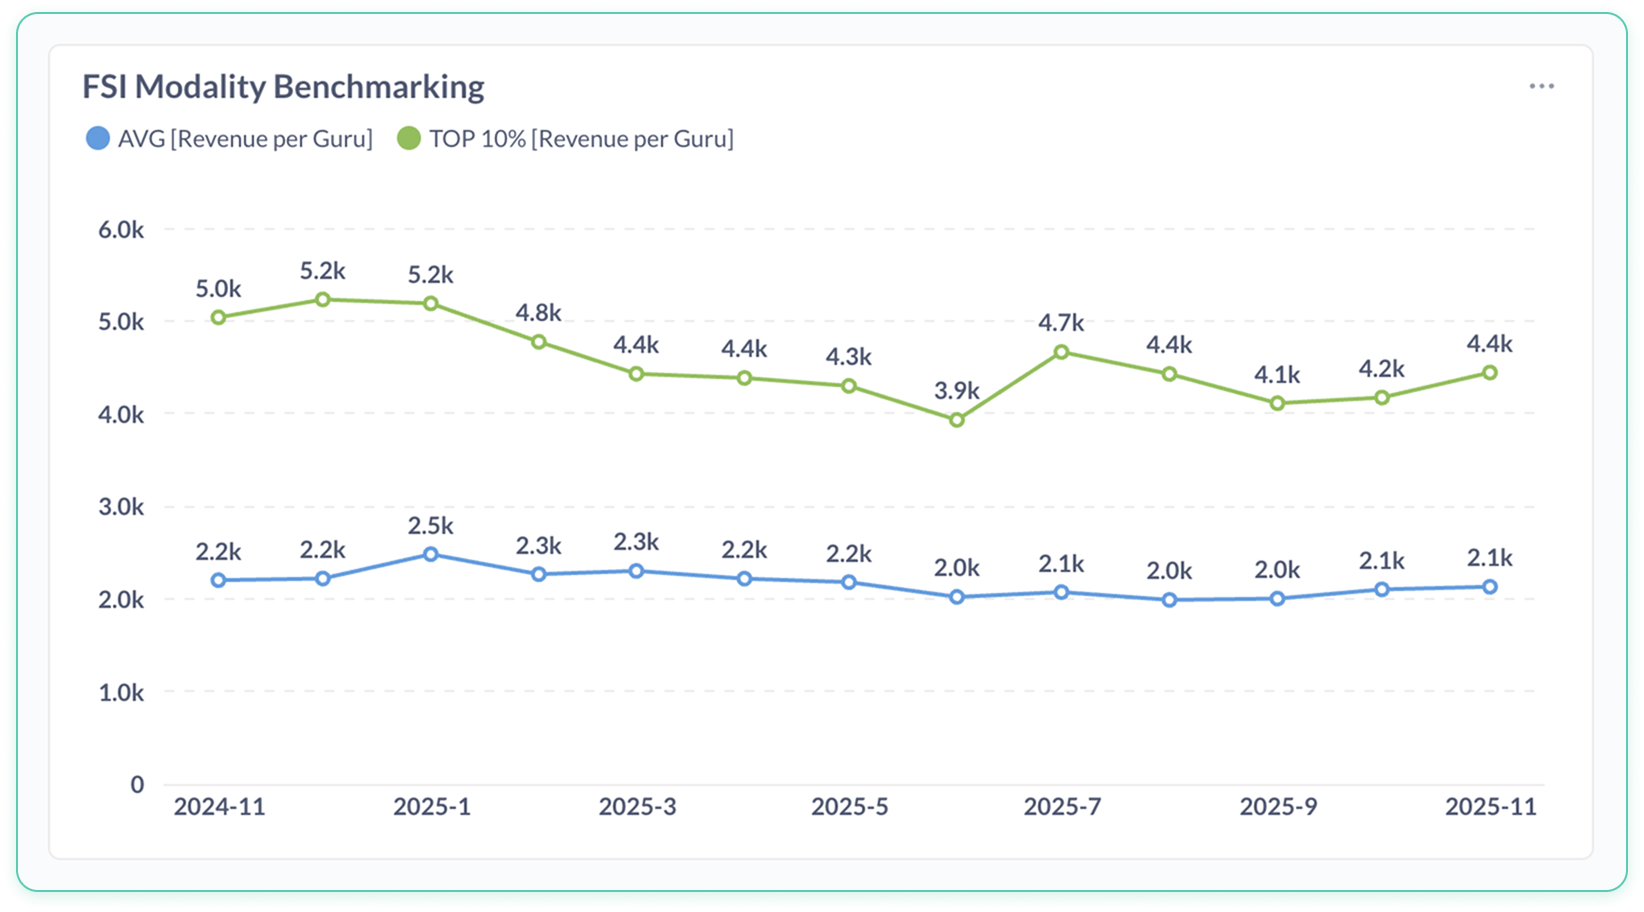
Cycling Benchmarking › Revenue per Instructor
What matters here: Revenue per instructor at top decile studios has declined ~10% vs remaining stable in average studios, but the top decile of instructors bring over 2x the revenue of the average instructor.
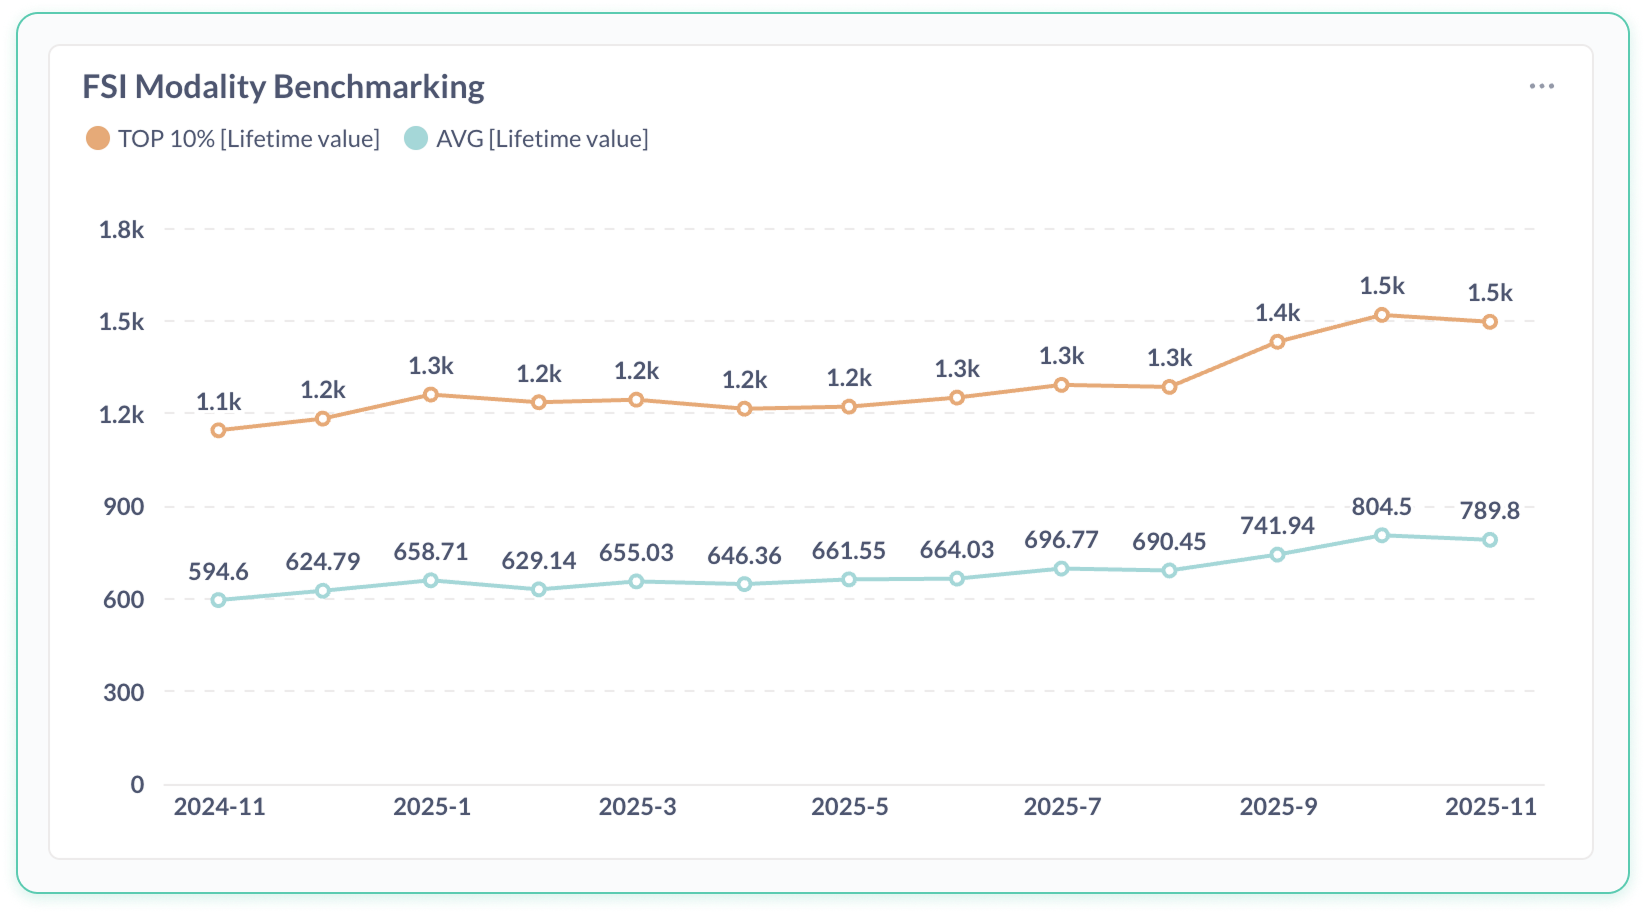
Cycling Benchmarking › Lifetime Value
What matters here: Lifetime value increases for top-decile studios while the average lags behind, widening the gap across the period.
Concept (Cycling)
Note: You don’t need to follow the math — this simply explains why studios can have great members but still earn less per location.
We evaluate early-client value and instructor revenue concentration.
Early Value Proxy
Early Value ≈ Return Behavior × Revenue per ClientCalculation
Earlier: 0.53 × ~$80 ≈ $42
Later: 0.35 × ~$80 ≈ $28
Interpretation
A decline of roughly one-third in early-client economic value.
Instructor Revenue Distribution:
Top instructors: ~$4.4k–$5.2k
Average instructors: ~$2.0k–$2.3k
Cycling Interpretation
Revenue is disproportionately generated by a small number of “hero” instructors, making the modality operationally fragile and difficult to scale.
Next Section: Future Modality Potential

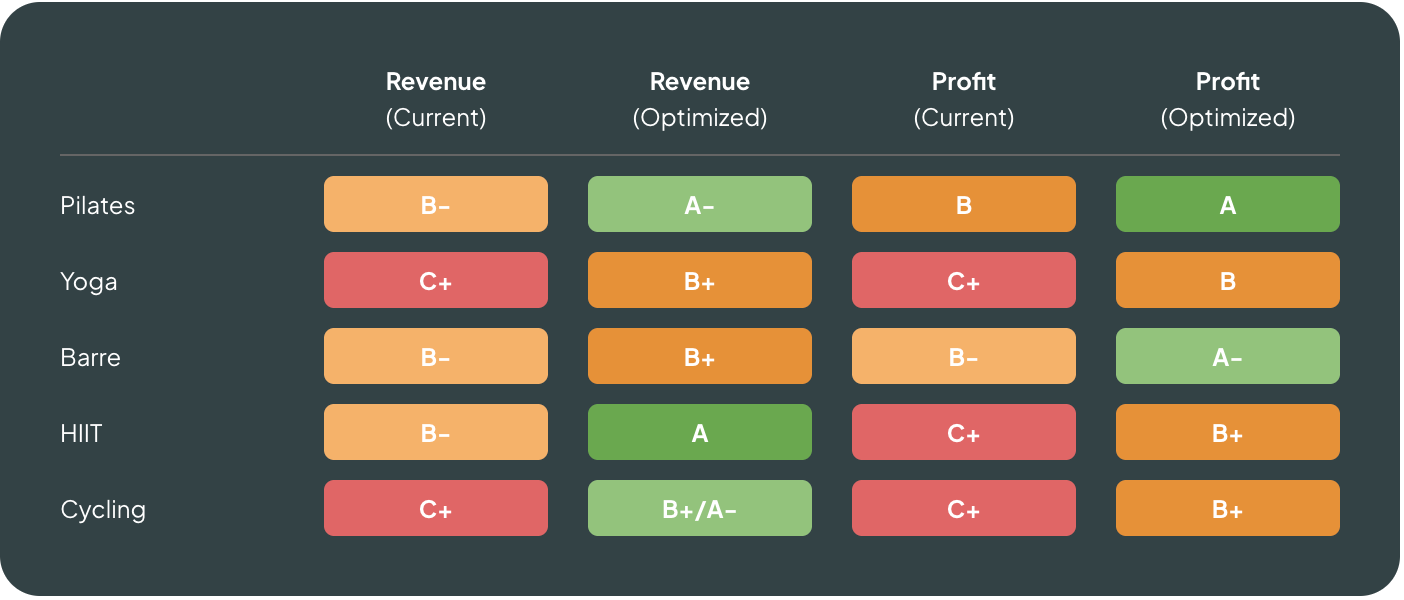
Future Modality Potential
Below is the current and optimized potential of each modality based on demographic trends and operational ceilings.
As can be seen, the future of every modality - including perennially criticized modalities like cycling - have a very bright future if specific structural issues are fixed.
Note: This is just based on the review of 6 of the metrics we looked at. We may find, on further review, that with other metrics included the grades for different brands change - perhaps for the better.
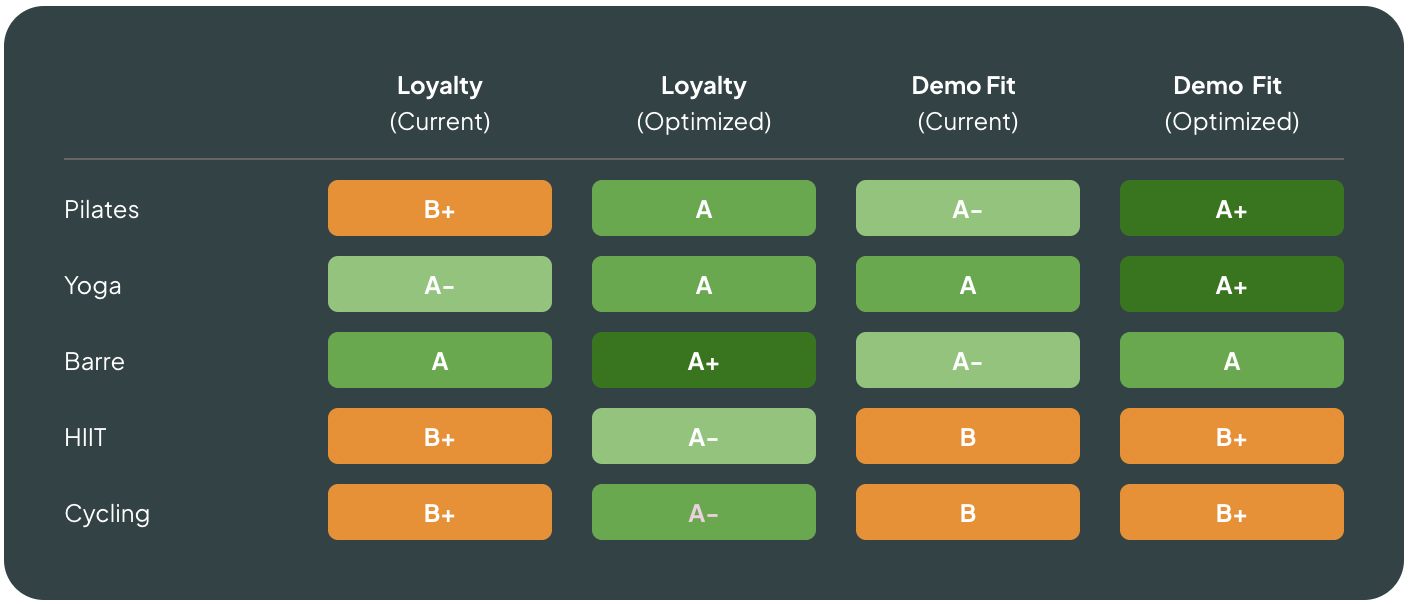
Interpretation of Ratings
This rating reflects how well each modality aligns with:
Aging population (desire for lower-impact, joint-safe movement)
Mental health & stress reduction demand
Rise of recovery & mobility
Post-pandemic community desire
Youth & millennial preference patterns
Desire for identity-based fitness
Shift toward longevity fitness vs intensity fitness
Cultural adoption cycles
When you see Pilates and Yoga at the top, it’s because these modalities fit beautifully into emerging global wellness trends.
Cycling, Barre, and HIIT can all remain strong — but must adapt their offering, intensity, or community models to remain competitive with demographic shifts.
Next Section: Debate Ending Charts

Debate-Ending Charts
Many are confused by why booking platforms and their cross-booking platform products (e.g. Classpass, iKizmet, FitMetrix, etc.) cannot produce full-market insights and true industry benchmarks.
Let me explain clearly: different booking platforms can produce wildly different studio outcomes and metrics, so what happens on one platform does not mean it is happening on another.
Because they can miss what is happening on another platform, any insights cannot and should not be classified as “industry-wide date” but rather “platform specific data”.
See the charts below.
Methodology: All data was standardized according to the definitions in the Universal Fitness KPI Dictionary FitGrid created and has started to publish at universalfitnesskpis.com. This made the metrics, across booking platforms, comparable - apples-to-apples. This was executed across millions of data points and thousands of studios. What we found surprised us.
We also anonymized the metrics and the booking platforms represented to protect the data of our partners.
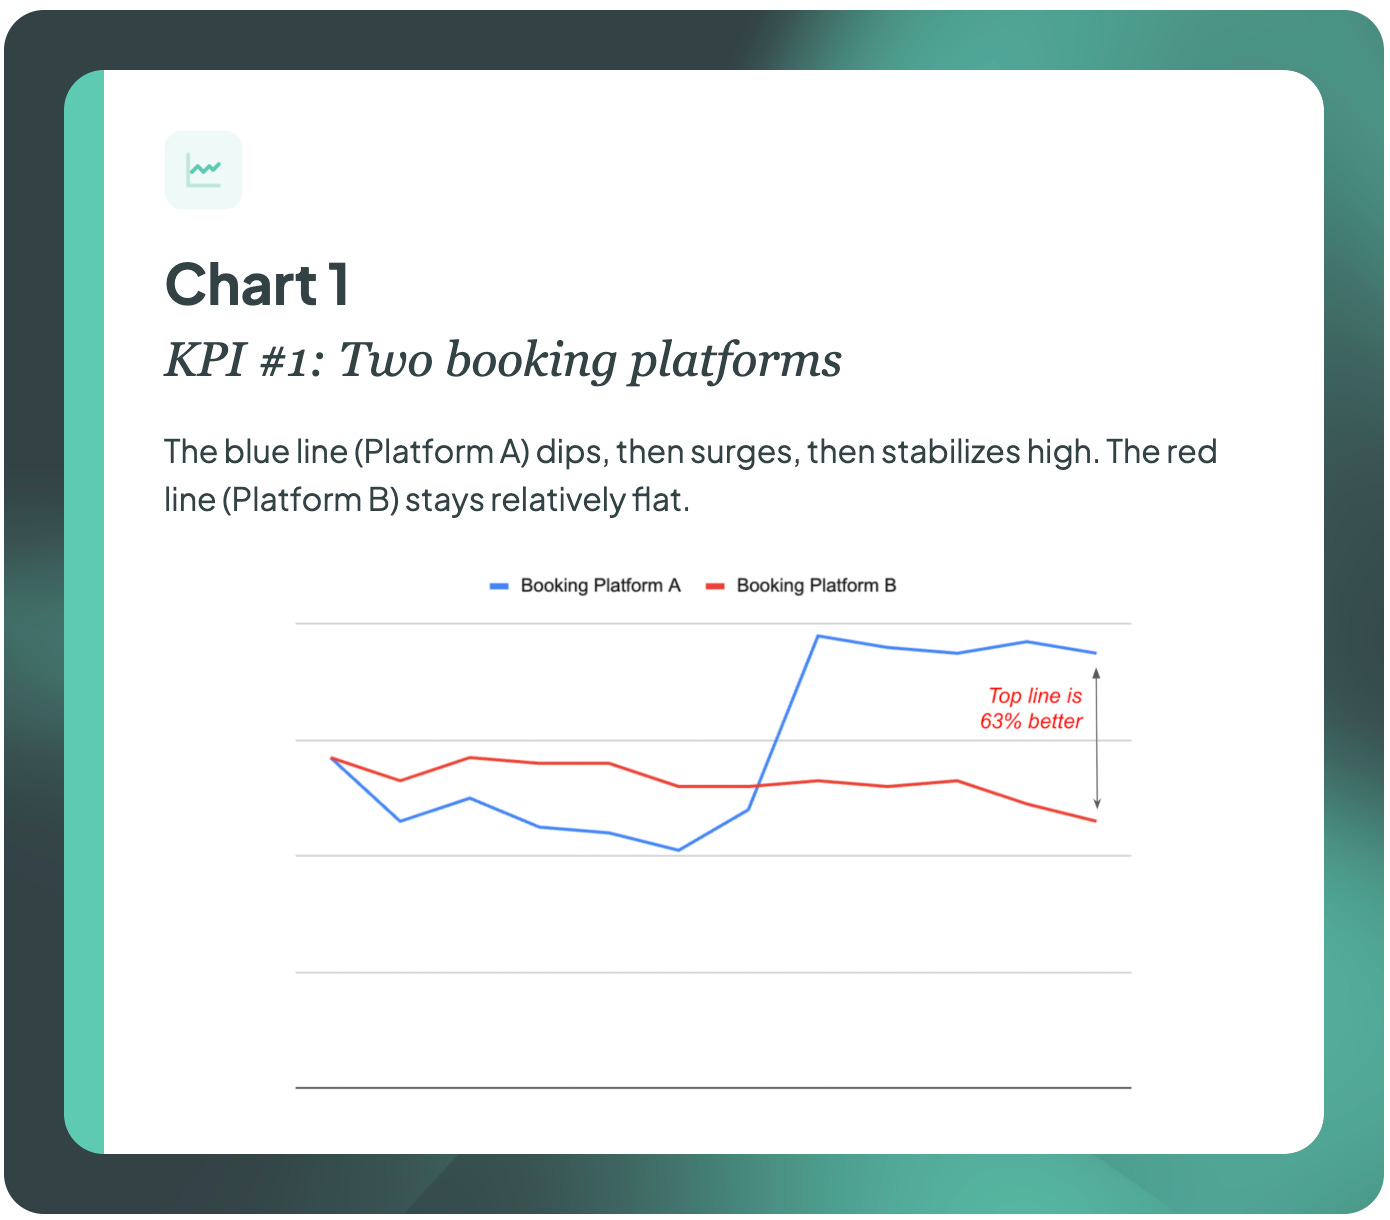
KPI #1: Two booking platforms
The blue line (Platform A) dips, then surges, then stabilizes high. The red line (Platform B) stays relatively flat. Booking Platform A performs 63% better on this metric than B.
If Booking Platform B created a report and called it an “industry report”, it would be mislabeling it because it has no idea that metric surged on Booking Platform A.
KPI #2: Same two booking platforms
Now the red line (Platform B) sits consistently above the blue line (Platform A), while Platform A drifts downward.
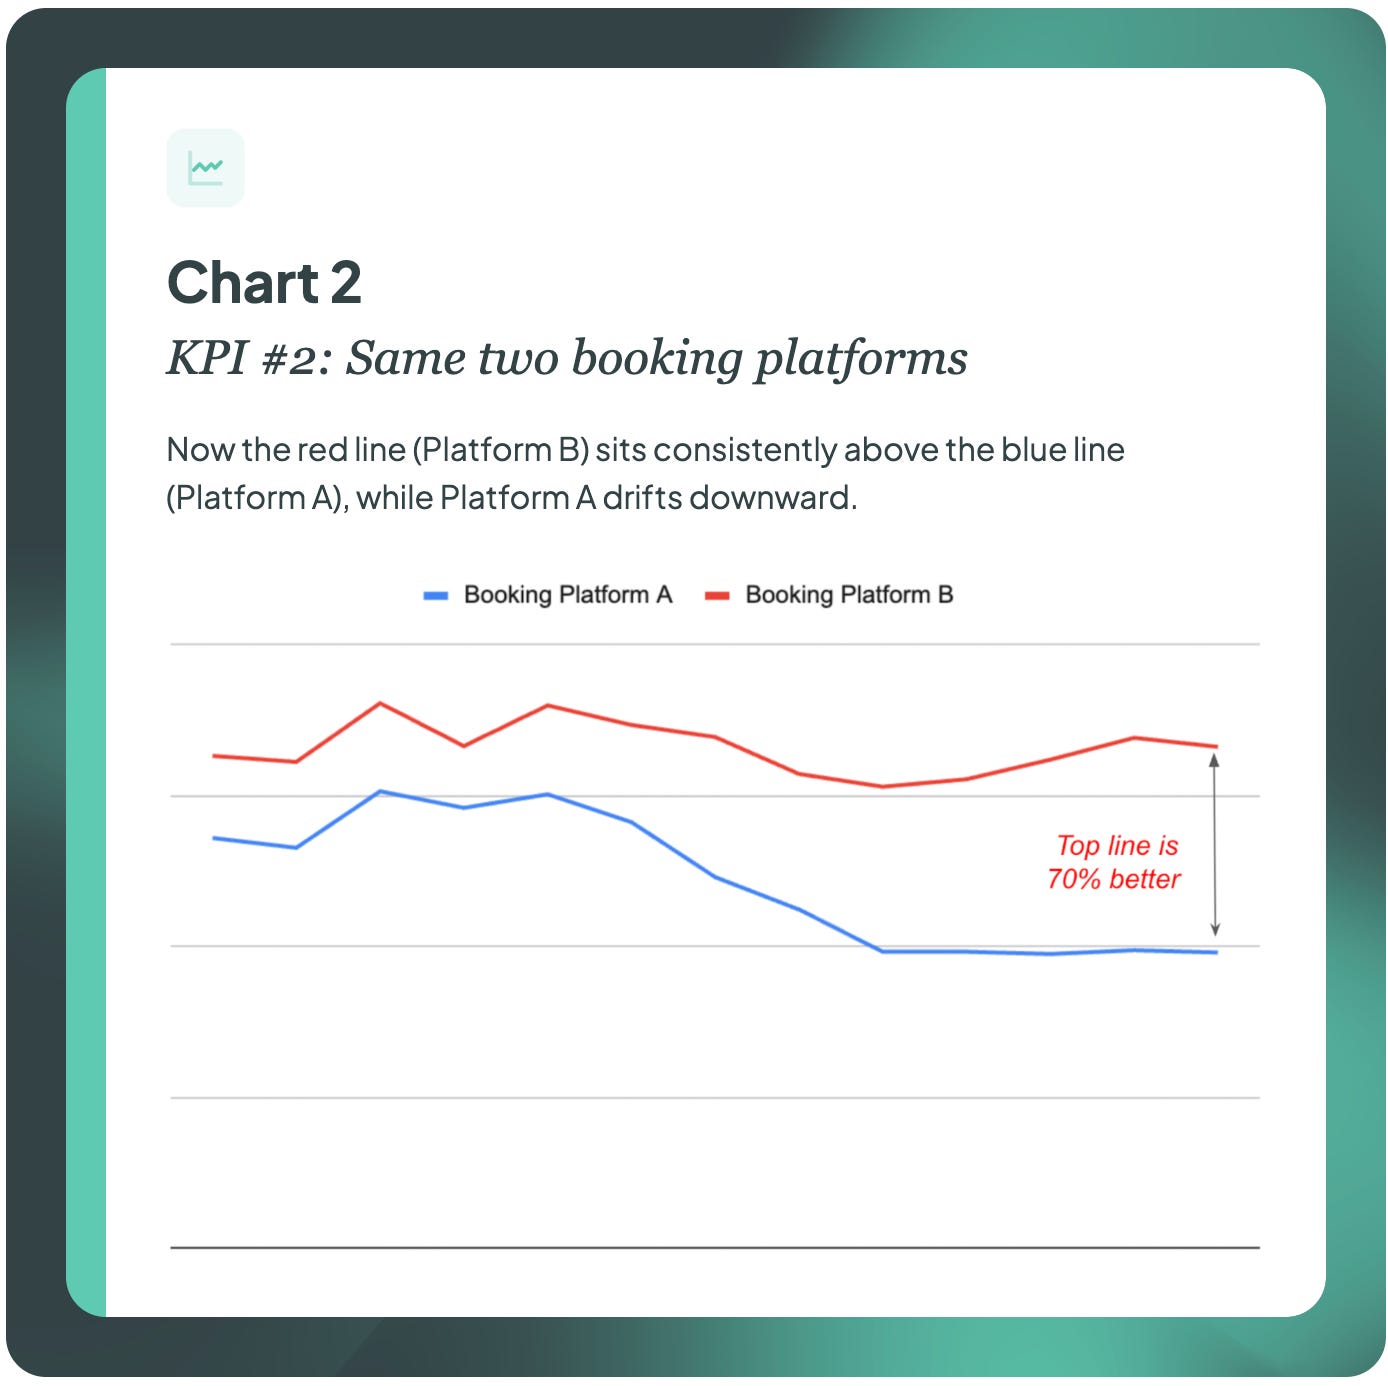
These differences are not anomalies, seasonality, or data noise. They stem from how each platform structures:
client communication
automation and reminders
intro offers
sales workflows
instructor tools
scheduling mechanics
This discrepancy is normal and expected. Booking platforms are not neutral. They actively invest in improving outcomes for the studios on their systems. They even buy companies that improve those outcomes.
We just previously didn’t know how big the discrepancies could be.
Btw, trying to jump technologies purely on the basis of which provides better metrics is a losing game. One that is up today can be down tomorrow. Better to focus on improving your own operational outcomes.
Finally, to address the idea that cross-booking platform products like ClassPass, FitMetrix, Ikizmet, or any other booking-platform-owned entity can be used to give booking systems a way to produce true, cross-booking platform, full-industry insights and benchmarks, we offer the following insights:
Entities like that are owned by a booking platform, and most other booking platforms would not trust a competitor with their core data because they are not neutral
Some cannot, legally and due to their relationship with studios, pull data on more than the clients they provide (for example, ClassPass, Wellhub). As a result, they cannot say what 1st time client return rates are across all clients - just the ones they introduce. ClassPass, for example, can see only the approximately 10-15% of clients they provide (in the average studio) and those are not a studio’s core audience
Such products and companies are now owned by booking platforms and have been modified to provide their benefit to only studios on that platform, so they stopped consistently pulling data from other platforms
This is now a settled issue:
The intelligence layer cannot come from a booking system.Booking platforms are essential operational systems. But they were not designed to compare performance and brands industry-wide.
FitGrid’s cross-booking platform dataset exists precisely because no single platform can represent the industry.
The referee must sit above them.
Next Section: Questions Being Asked

Questions Being Asked
With standardized KPIs and cross-platform visibility now available, leadership teams should expect a new category of questions in boardrooms, diligence rooms, and analyst conversations. These questions are not adversarial - they are now inevitable.
Examples include:
How does your first-time client return rate compare to top-decile performance in your modality?
What percentage of your system exhibits rising mid-journey drift?
If lifetime value is rising but revenue per location is falling, where is the gap occurring?
Which instructors materially influence monetization, and how are you replicating their behaviors across your system?
Are your booking-platform KPIs reflecting operational performance or platform-specific artifacts?
How far is your median franchisee from top-decile operators in the modality?
What operational levers are you deploying to move the middle of your system upward?
Brands that can answer these questions will:
strengthen investor confidence
support higher valuation multiples
build more predictable AUV
stabilize franchisee economics
and accelerate development
Brands that cannot answer them will face avoidable credibility challenges.
Next Section: Results Matter

Stakeholder Relevance
This newsletter issue, combined with the Universal Fitness KPI Dictionary, offers every member of the boutique fitness ecosystem a level of clarity going into 2026. In many cases that clarity materially affects the lens through which they view their job and the effectiveness with which they can execute it.
Independent Operator - Identifies where revenue is leaking and how to fix it.
Franchisor Leadership - Exposes system-wide blind spots that are otherwise invisible.
Franchisee - Clarifies whether they are truly profitable or simply busy.
Franchisor Investor - Differentiates real unit economics from averages inflated by top performers.
Roll-Up Operator - Shows which studios to buy, which to improve, and which to avoid.
Industry Analyst - Reveals operational truth behind AUV and growth narratives.
Dealmaker - Provides a reliable framework for operational due diligence.
Booking Platform Executive - Shows the limits of platform-level KPIs and the need for a neutral intelligence layer.
Consultant - Supplies a standardized diagnostic model instead of inconsistent, platform-specific analytics.
Next Section: Summary

Summary
The insights in this issue may feel surprising or unsettling. They were invisible until now because the industry lacked a standardized language for performance and no capability to compare results across booking platforms. The KPI Dictionary changes that. Cross-booking platform insights change that. FitGrid changes that.
With standardized KPIs, it becomes clear that:
early-stage value has declined across the industry,
mid-journey drift is rising,
revenue per location is weakening in several modalities,
and the operational gap between average and top-decile studios has widened dramatically.
But the most important finding is also the most hopeful:
every one of these problems is fixable. In every modality, a subset of studios has already solved the issues the rest of the market is struggling with. Success is not a mystery; it is a repeatable pattern.
Booking platforms that align with standardized KPIs will become materially more valuable to their customers - and platforms that resist standardization will lose credibility.
If the years leading up to 2026 were foggy, then 2026 becomes the beginning of clarity. Operators and franchisors who act on this intelligence will pull away from the field. Those who do not will watch others, with clearer visibility and better tools, move decisively ahead.
Still pushing the boulder uphill, but now with a map,
Nt Etuk
Founder & CEO, FitGrid
Co-Founder & Chairman, The BFS Network